
Trading Edge: Part 1 Context
Context is king!


Trading is about Edge. What is your edge? What is my edge? Here, on the VWAP Report, I only talk about my edge, which is VWAP. In doing so, I am conscious that not everyone knows how to trade this, how to use VWAP or indeed what are the other elements that one should use when trading a vwap strategy. So in this post series, I’m going to break it down.
We are going to cover.
Part 1: Context
It is all great being able to spot support and resistance. Its pretty simple. Easy to say for someone who has been in front of chart screens for almost 20 years, but S&R (support and resistance) is incredibly important. For anyone who struggles with this, please watch this free video on our site. It is part of the pro traders course which is free. Its a collection of basic starter videos for traders.
Okay, so now that we know how to identify S&R, Let's move on.
What most people are unaware of each day in any market, is that there is an auction at play. A lot of people make the mistake of thinking about the current auction and its highs and lows. Well, first, what is the auction?
Auctions:
A single auction is a 30 min period during the traditional market hours. For oil, the market hours are 14:00 London time through to 19:30. For ES, its 14:30pm London time through to 21:30 pm. We call these RTH- Regular Trading Hours. For the electronic session that starts in London at 23:00 and closes at 22:00 we refer to this as ETH- Electronic Trading Hours.
So when I talk about oil, We had a nice day's auction yesterday, I am referring to the value area that was created yesterday. If I may say, ‘we had a really nice opening auction on oil today’’. I am referring to the opening 30mins on RTH ie. 14:00 to 14:30 London time.
Let's just stay with oil for now.
The basis for my directional edge comes from knowing are we above, within, or below the prior day's auction. See 2x weeks of single day volume auctions on oil here below. In these charts, I am plotting the PRIOR Days auction and moving it forward by 1 day. So I can see how today's market is reacting to yesterday's range of trade.
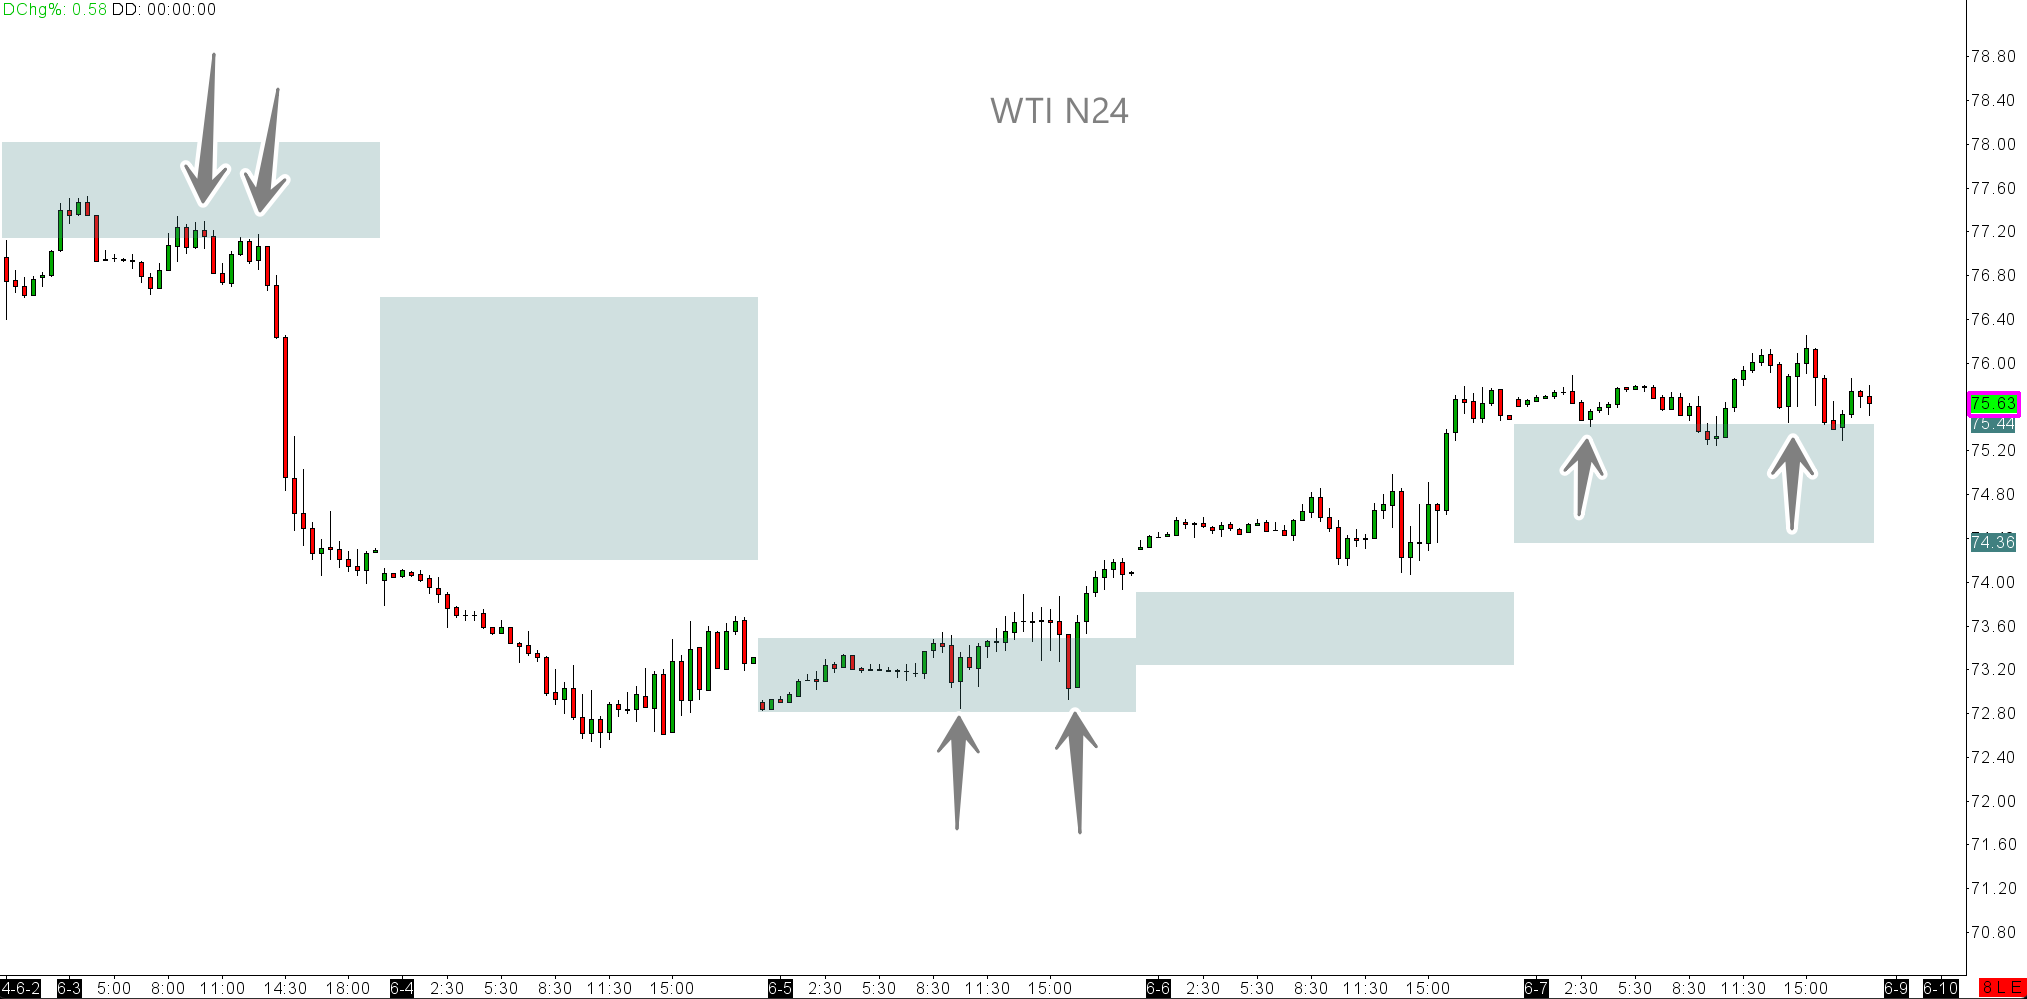
You will probably be thinking, well the range is not the whole prior days range. The reason for this is simple. I am getting the volume distribution range of the prior day and then overlaying only from +1 deviation down to -1 deviation. This gives me what I call the value area. You can see in both charts how the market reacted to this area throughout the entire week. I'm leaving S&R off to give us a clean look.

Now we are starting to see something that we can work with ! See below the same method on ES.

Or even Gold!

So, now that we can see how markets react to their prior days auction area (PVA) we can start to talk about context.
Some Key terms are as follows.
PVA - Prior Value Area +1 to -deviation of the prior day.
PVAH - Prior Value Area High +1 deviation of days average volume price.
PVAL - Prior Value Area Low. -deviation of day's average volume price.
Context.
We need to know at any time where a market is in relation to prior auctions. In this example we will only be looking at the intraday time frame ie. Day on day using 30min bars.
If a market is currently above its PVAH, then it is CONTEXT UP. We look to stay long or buy pull backs until it is within or below the prior day's value area.
If a market is below its PVA, we then look to sell and/ or sell pullbacks to the upside as long as it stays below the PVAL.
So lets look at that first oil chart again.

Or we can look at the ES chart again.

Now you can see the benefit of trading with the added filter of CONTEXT!
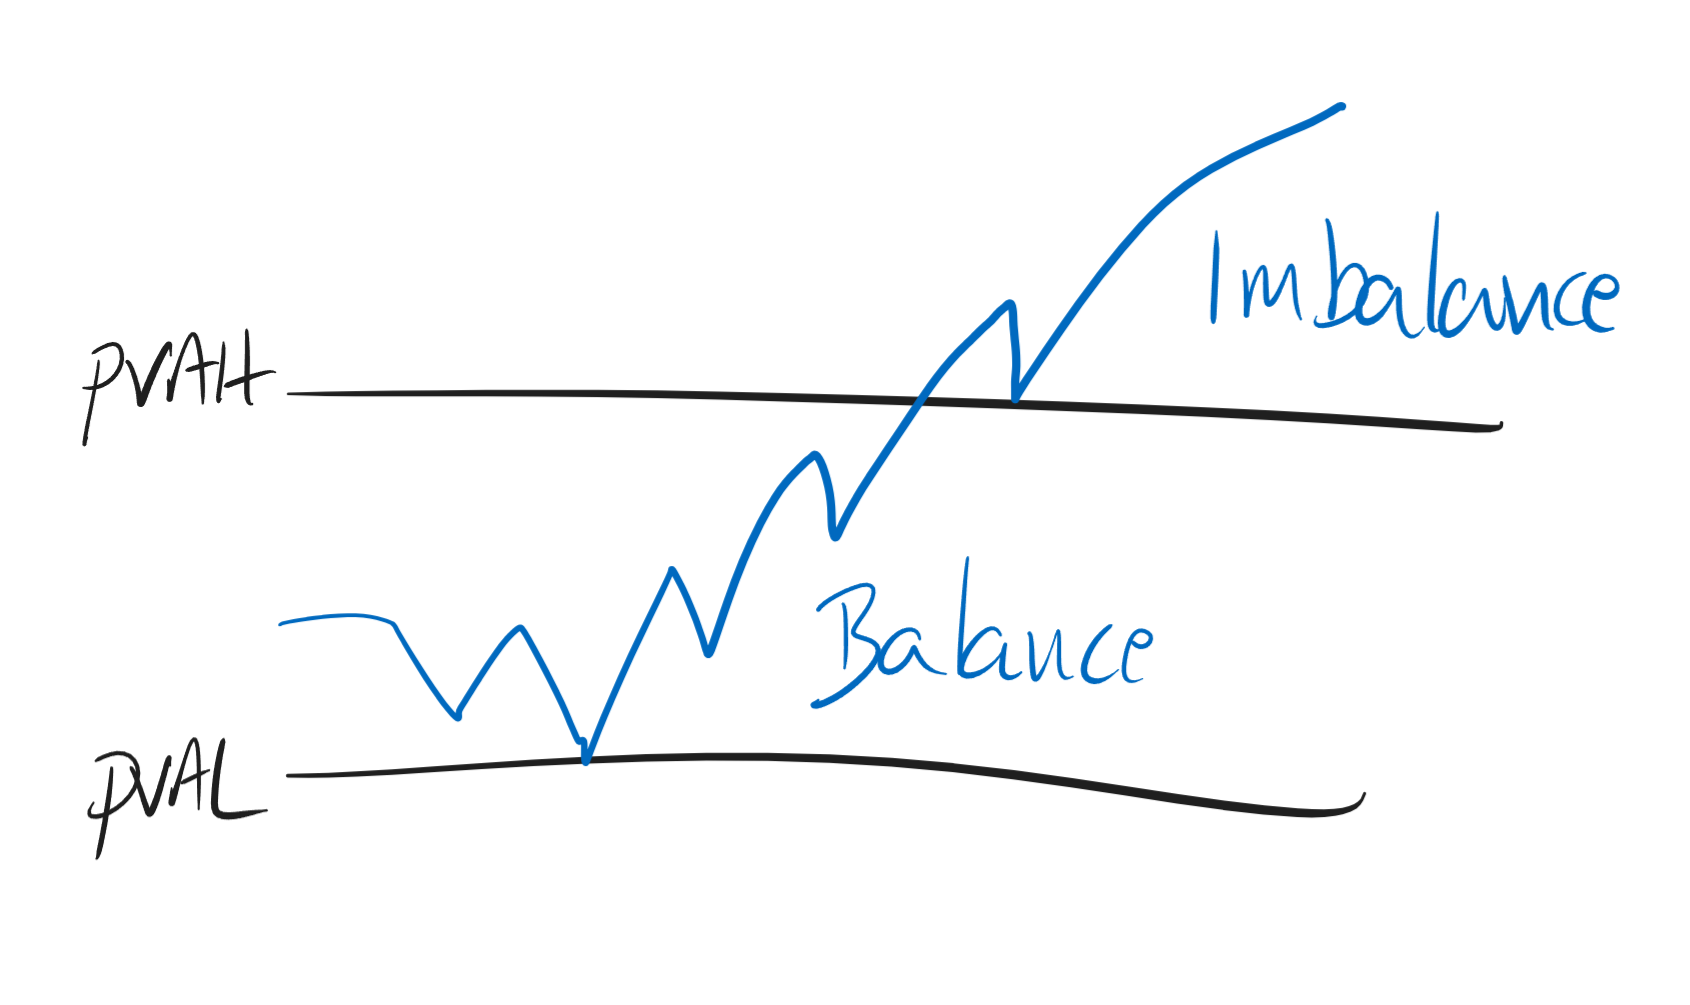
Balance & Imbalance.
When a market stays within a PVA we call this BALANCED. Using the charts above, look at the markets when they stay within the PVA. You can have a more controlled price behaviour. This is indicative that the market is respecting the prior auction and is getting ready over this session and perhaps the next for a breakout above or below the PVAH or PVAL. But until the breakout occurs, expect the market to remain within BALANCE ie. within the PVA structure.

When a market is trading outside its PVA, either to upside or downside, we call this IMBALANCED. Price can be either imbalanced up or imbalanced down. We tend to not trade against these contextual markers. So this means,
1 We don’t buy a market that is imbalanced down ie. below its PVAL, and
2 We dont sell a market that is imbalanced up ie. above its PVAH.
These rules can keep you out of an insane amount of trouble.

The goal of this post is to serve as a primer for observing Context.
You should now have a general view and understanding of how and why markets move the way they do. You have a contextual view of the market. Is a market balanced or imbalanced.
Tune in to the 2nd of this 3 part series where we add a little more filtering to our edge.
If you are interested to learn more and develop your edge, please visit our website The VWAP Report.
3 Month Alpha VWAP course. 3 months at £275 or £825 one of.
12 Month Alpha Edge Course. 5 days free trial £250per month or £3000 one off.
4 Week Alpha Pro Course. 4 Weeks intensive learning.
All courses include full access to the DC LIVE video trading Discord which is normally $200 US per month.
Keep it tight out there!