

Monday 8th Dec 2025
Markets await the Fed rate decision Wednesday
Overview: Oil market is covered in depth weekly on The Oil Report.
Selection criteria at bottom of report. Note dynamic levels, ie.vwap levels can and will shift intraday.
Notes:
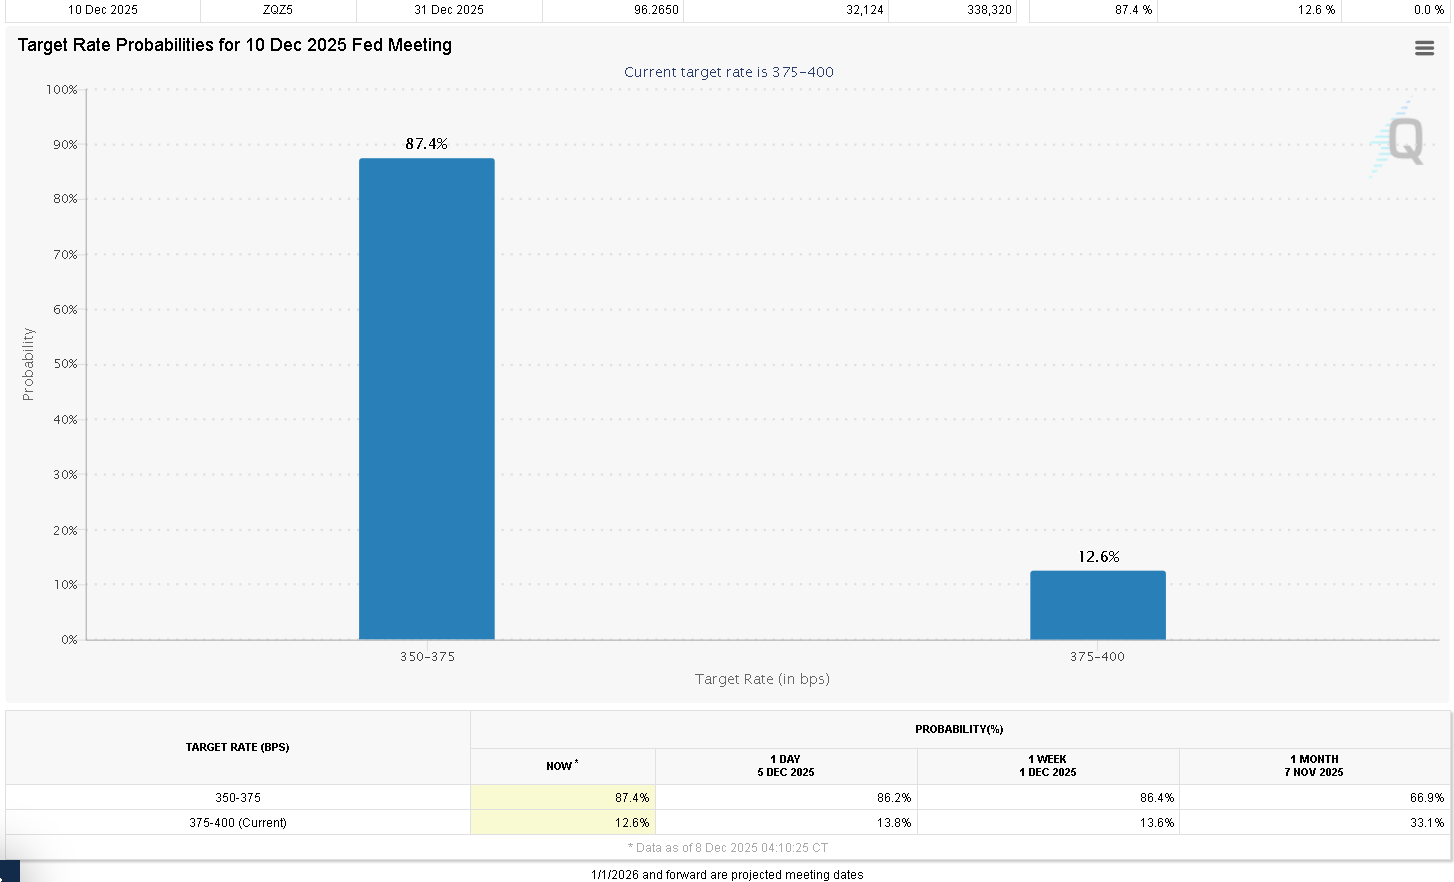
1 Markets await the Fed rate decision this Wednesday. Expected rate cut 25bps (0.25%) at a probability currently of 87.4%.
2: Trading and execution. Understanding the difference between CFDs and Futures is a must. A failure to understand the key difference is a big issue. CFDs are derrivitives of futures markets. This means that not every tick and market movement in futures is truely mirror reflected in the CFD. A futures market on NYMEX Oil is CLF2026, this is the true futures market for oil and the spot at the same time as it is the front month i.e the first next contract to setrtle on NYMEX for WTI crude. If you are trading USOIL, this is a derrivitive on NYMEX CL front month. If over the open oil moves 20 ticks up, then 50 down in the first 5 mins- the CFD USOil may only move 17 ticks up and 53 ticks down. The CFD is simply not a real futures market. In the old days, the CFD practice was called Bucketing, performed by Bucket Shops-famously covered in ‘Reminiscence of a stock operator. Some more on the practice here.
CFDs are not the same as futures. If you trade CFDs instead of futures, try to align your CFD charts (e.g., daily and 30-minute candles) with what you’d see on the futures market. The best way to follow my approach is to use the same analysis and tools I use—so you’re trading what you see, not treating this like a “signal service.” This is not a signal service. Also, the charts I post are not predictions of the week ahead; they’re scenario maps—how I’d like to see price develop into areas where I plan to trade, and the outcomes I’m aiming for. That distinction matters: I’m outlining setups, not forecasting.
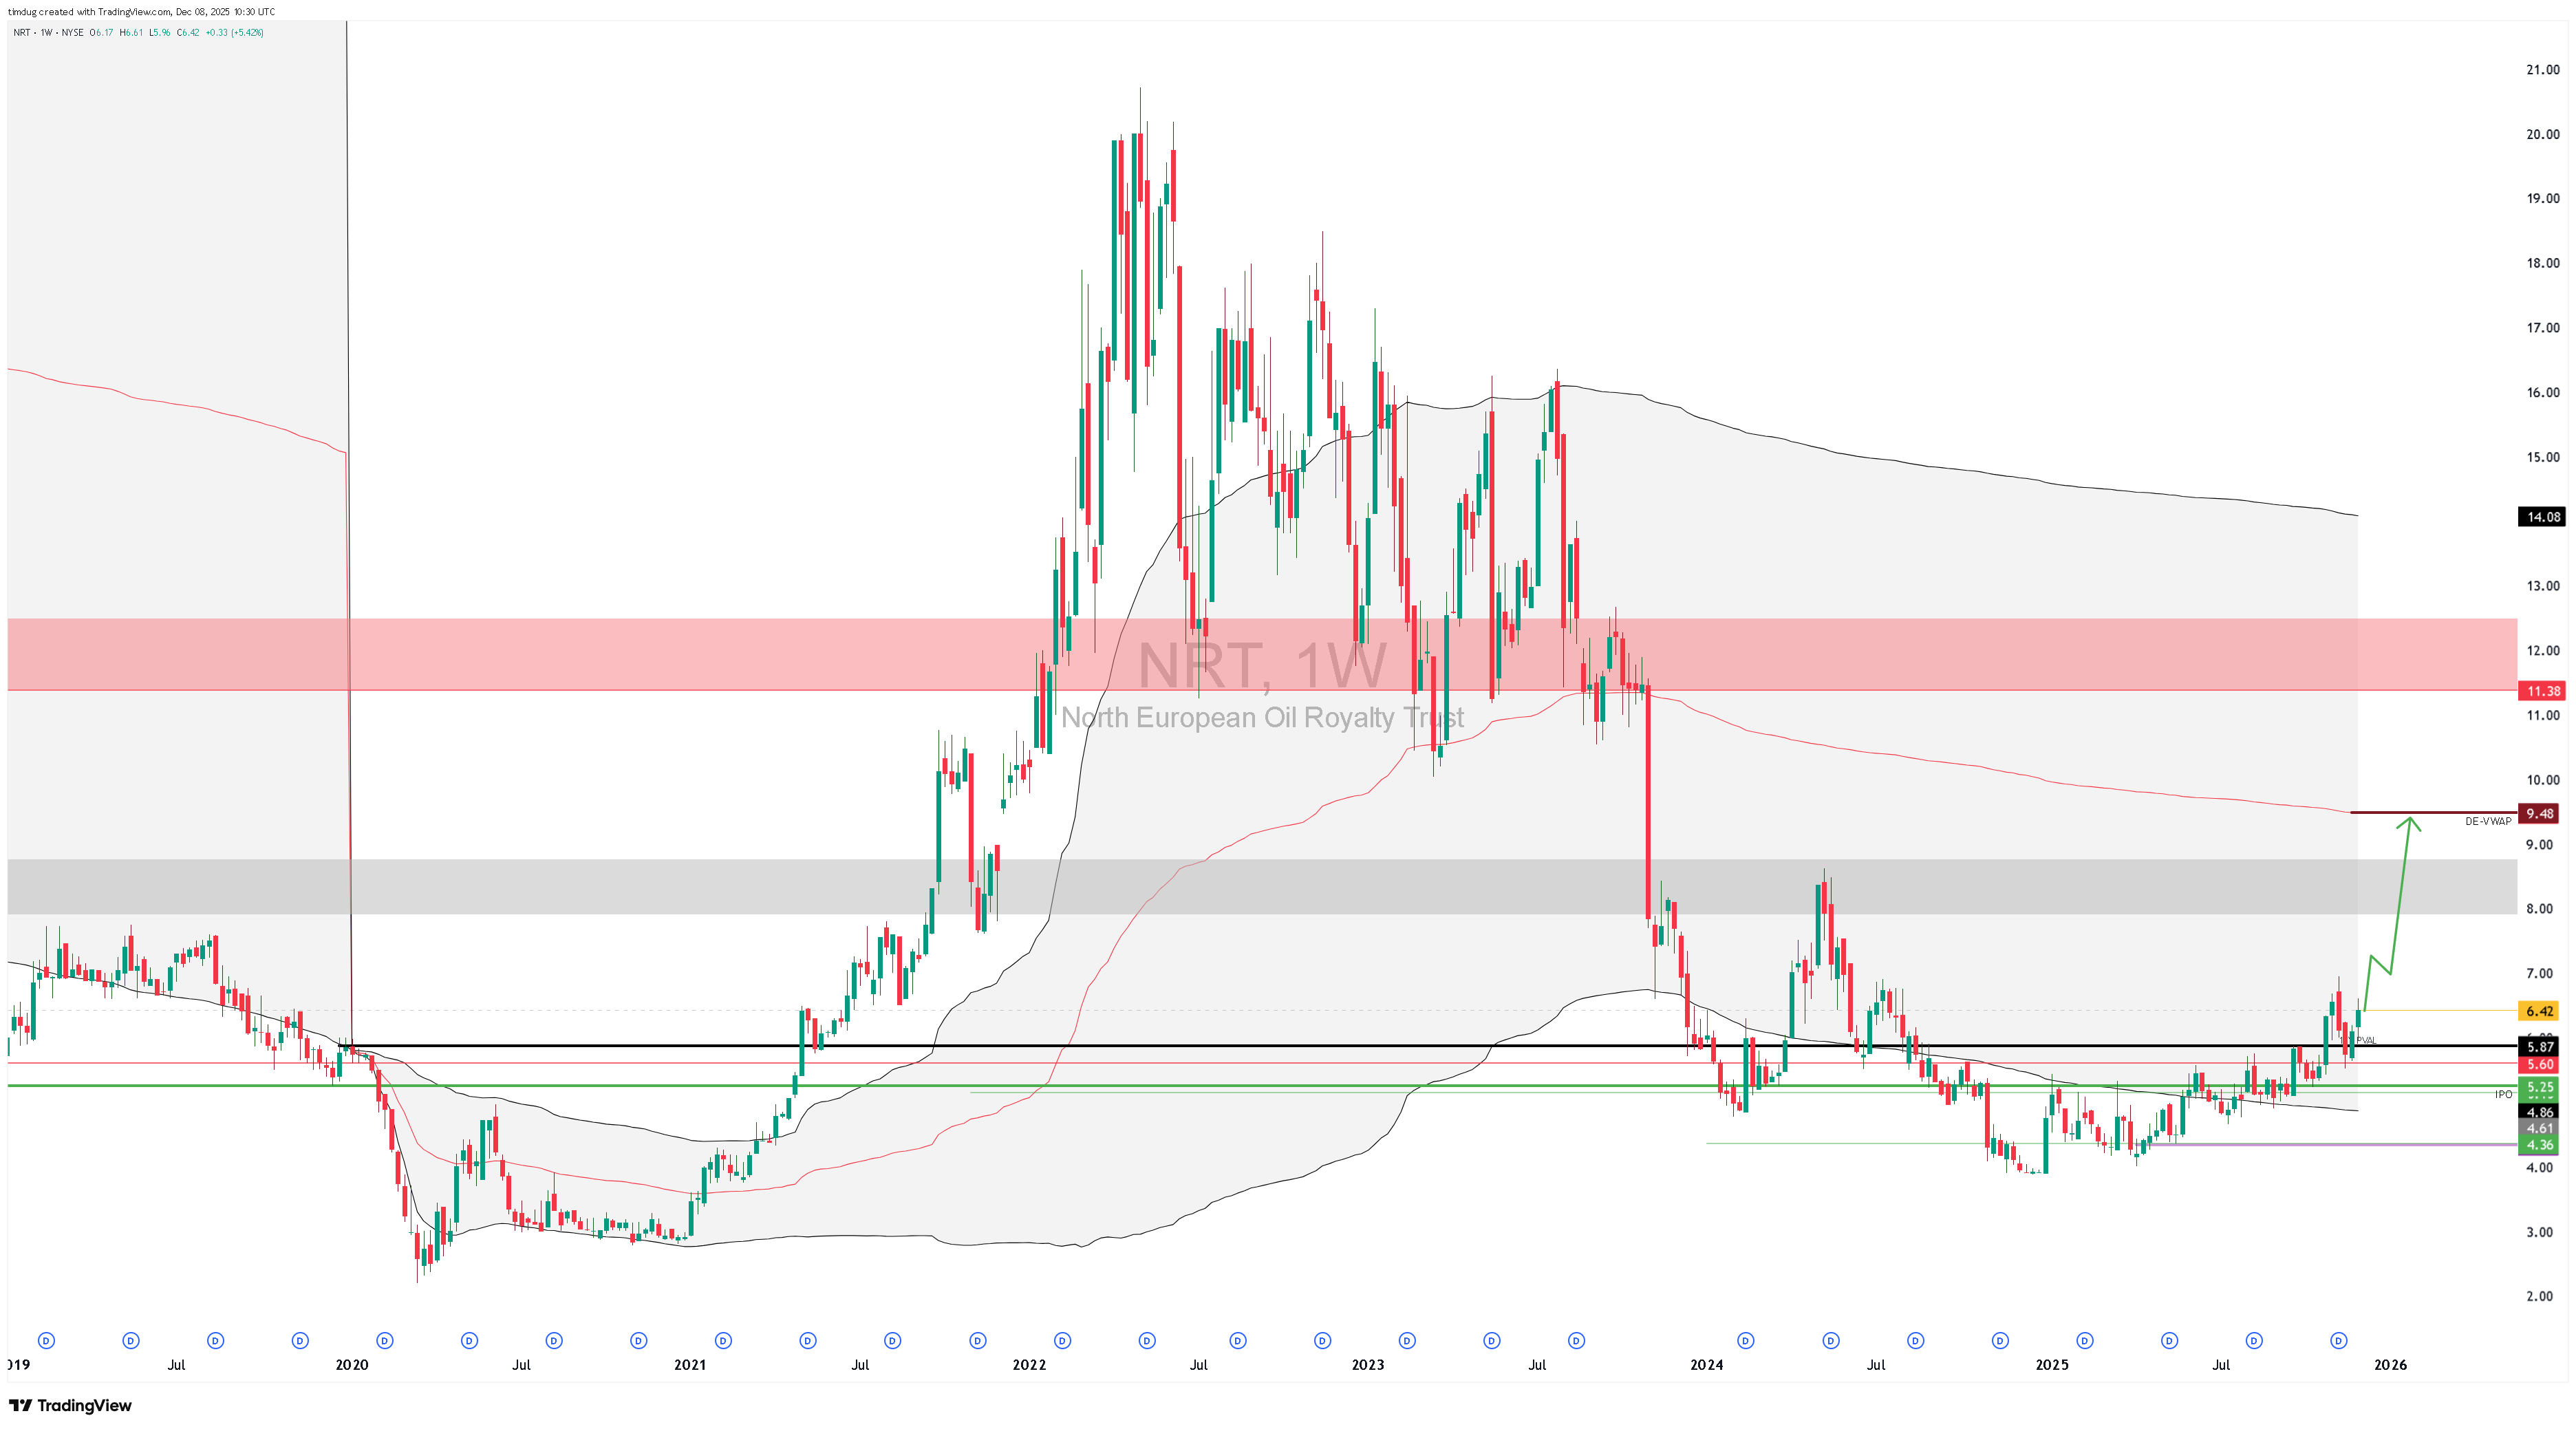
Market 1: North European Oil Royalty Trust.
Symbol: NRT 0.00%↑
Structure: IB Up on the year.
Setup type: Gert long, stay long. IPB Long at $5.25 up to $5.87
Bias: Long medium and long term.
Notes: +56% YTD. This is my single largest holding. Currently offering a TTM (Total Twelve Month) yield of 12.62%. Read more on the companies website or on Trading View.
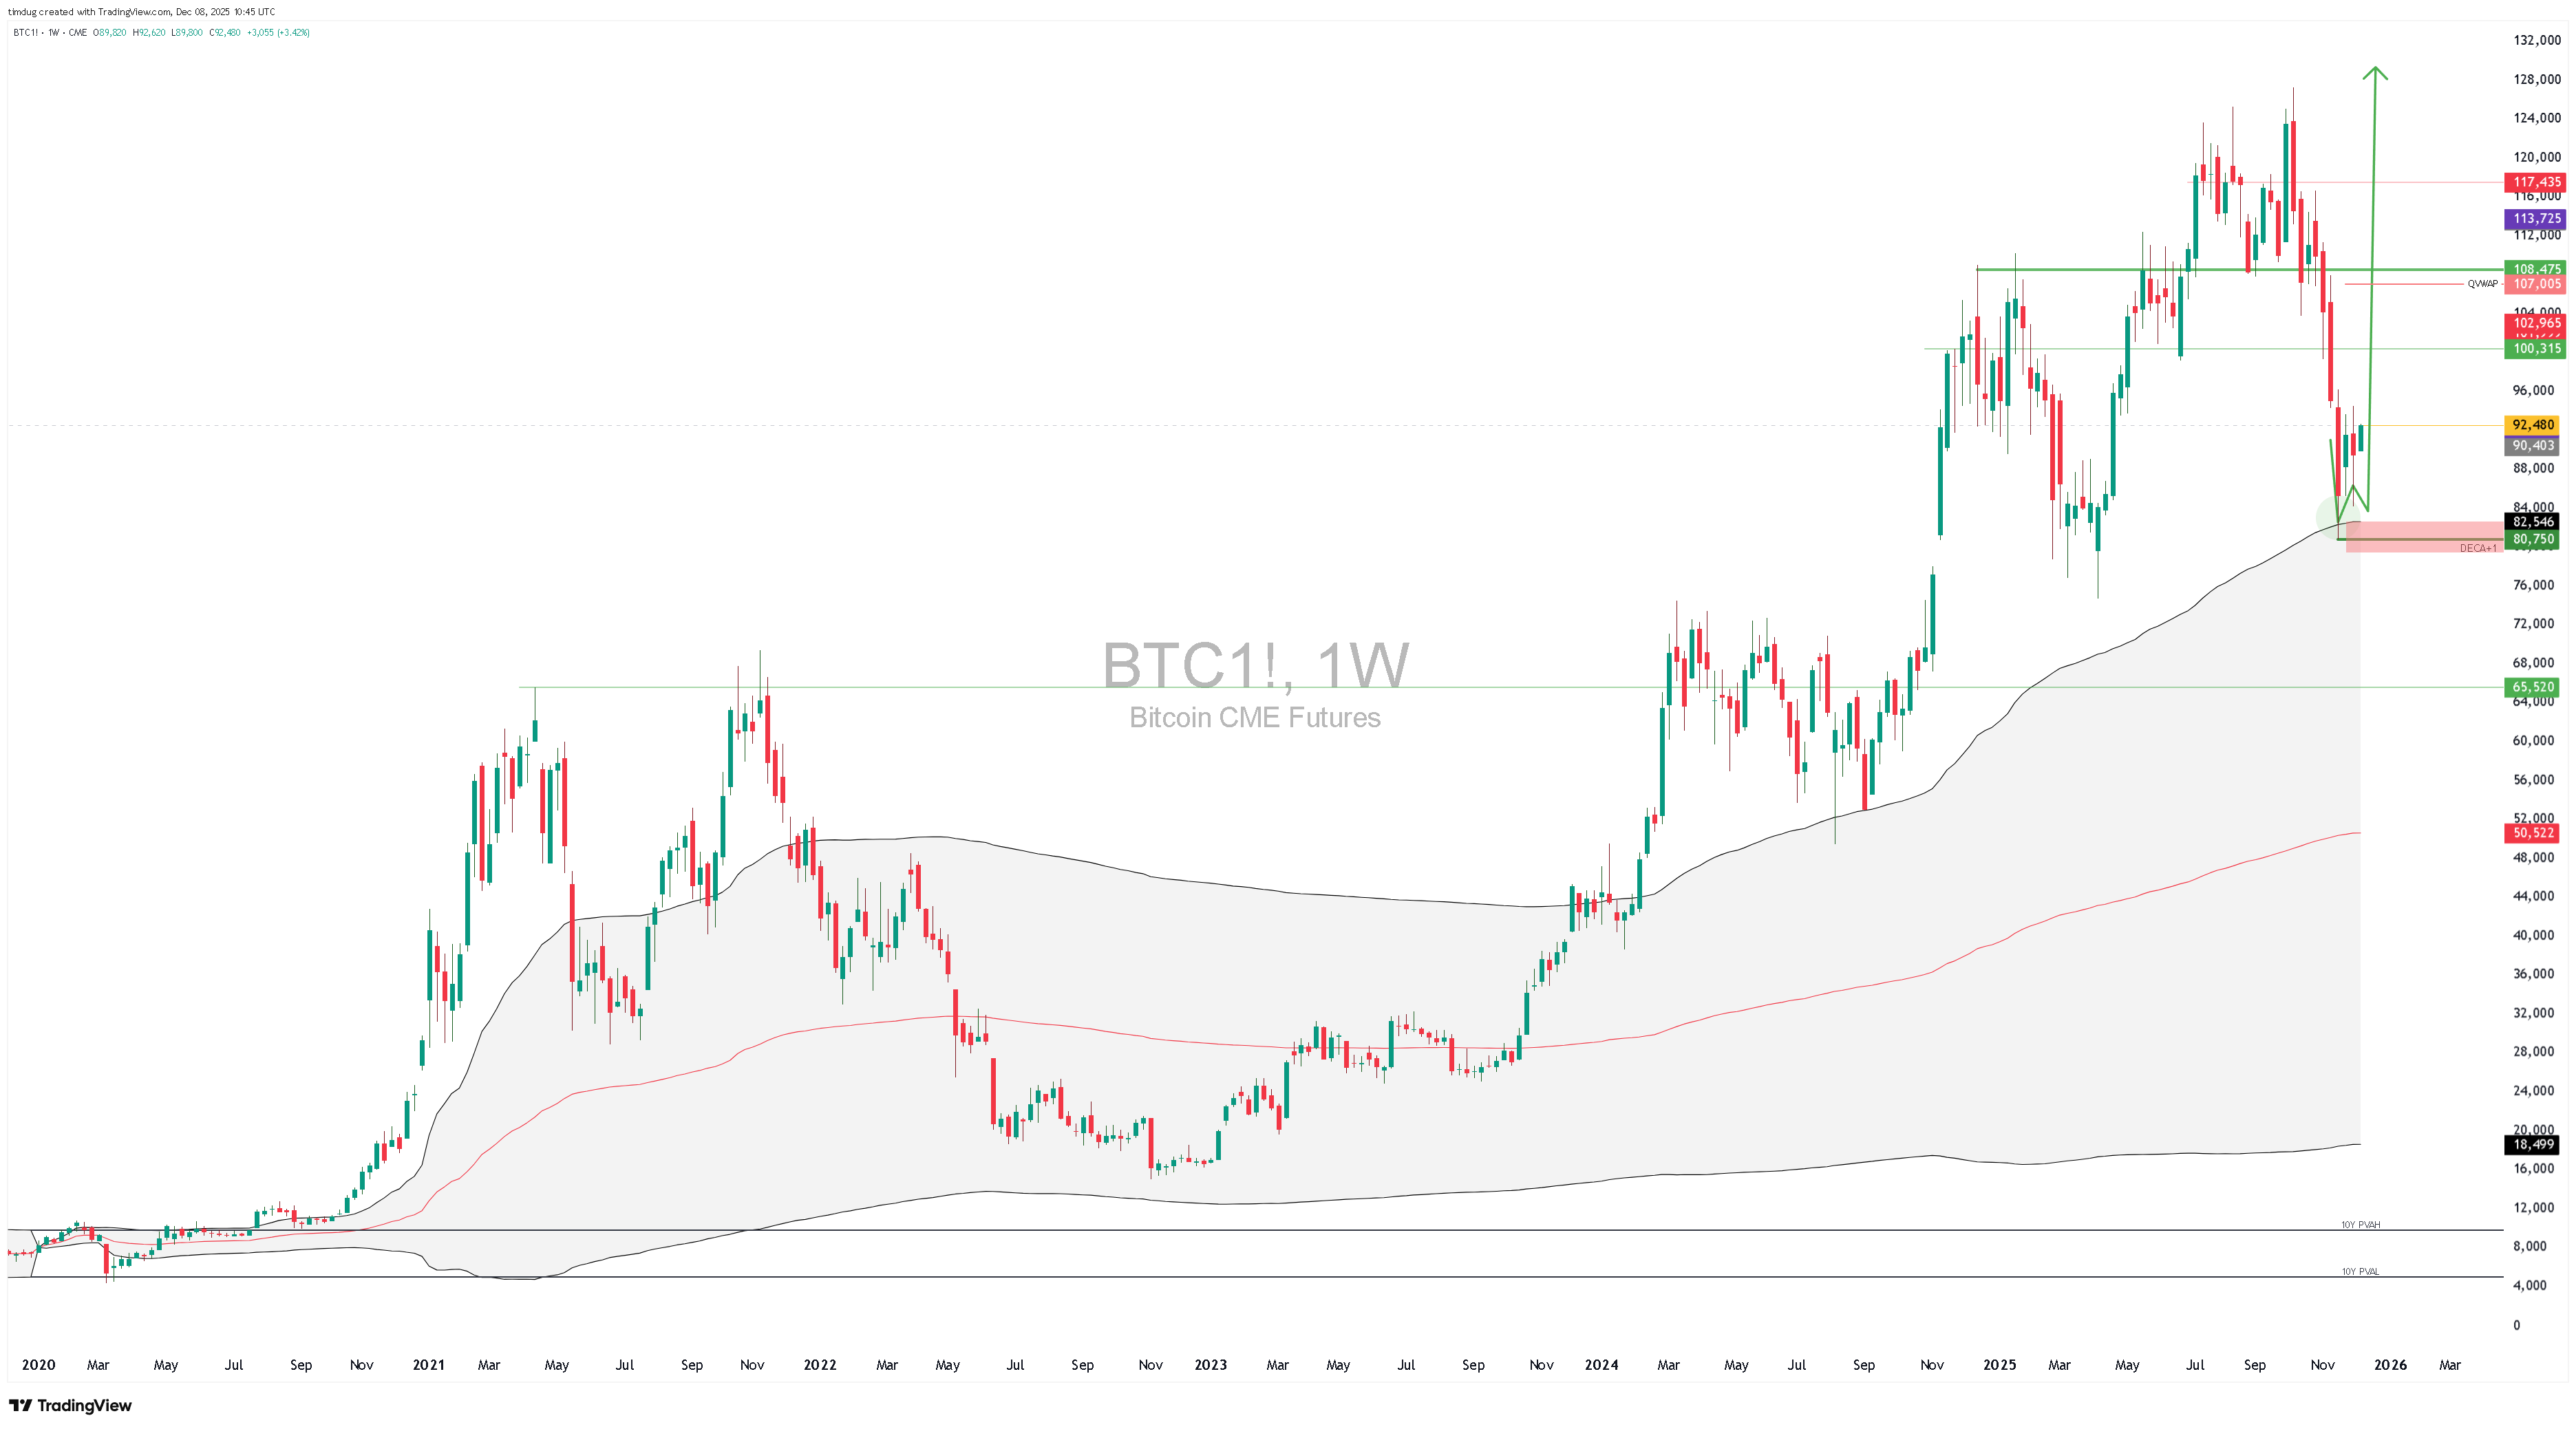
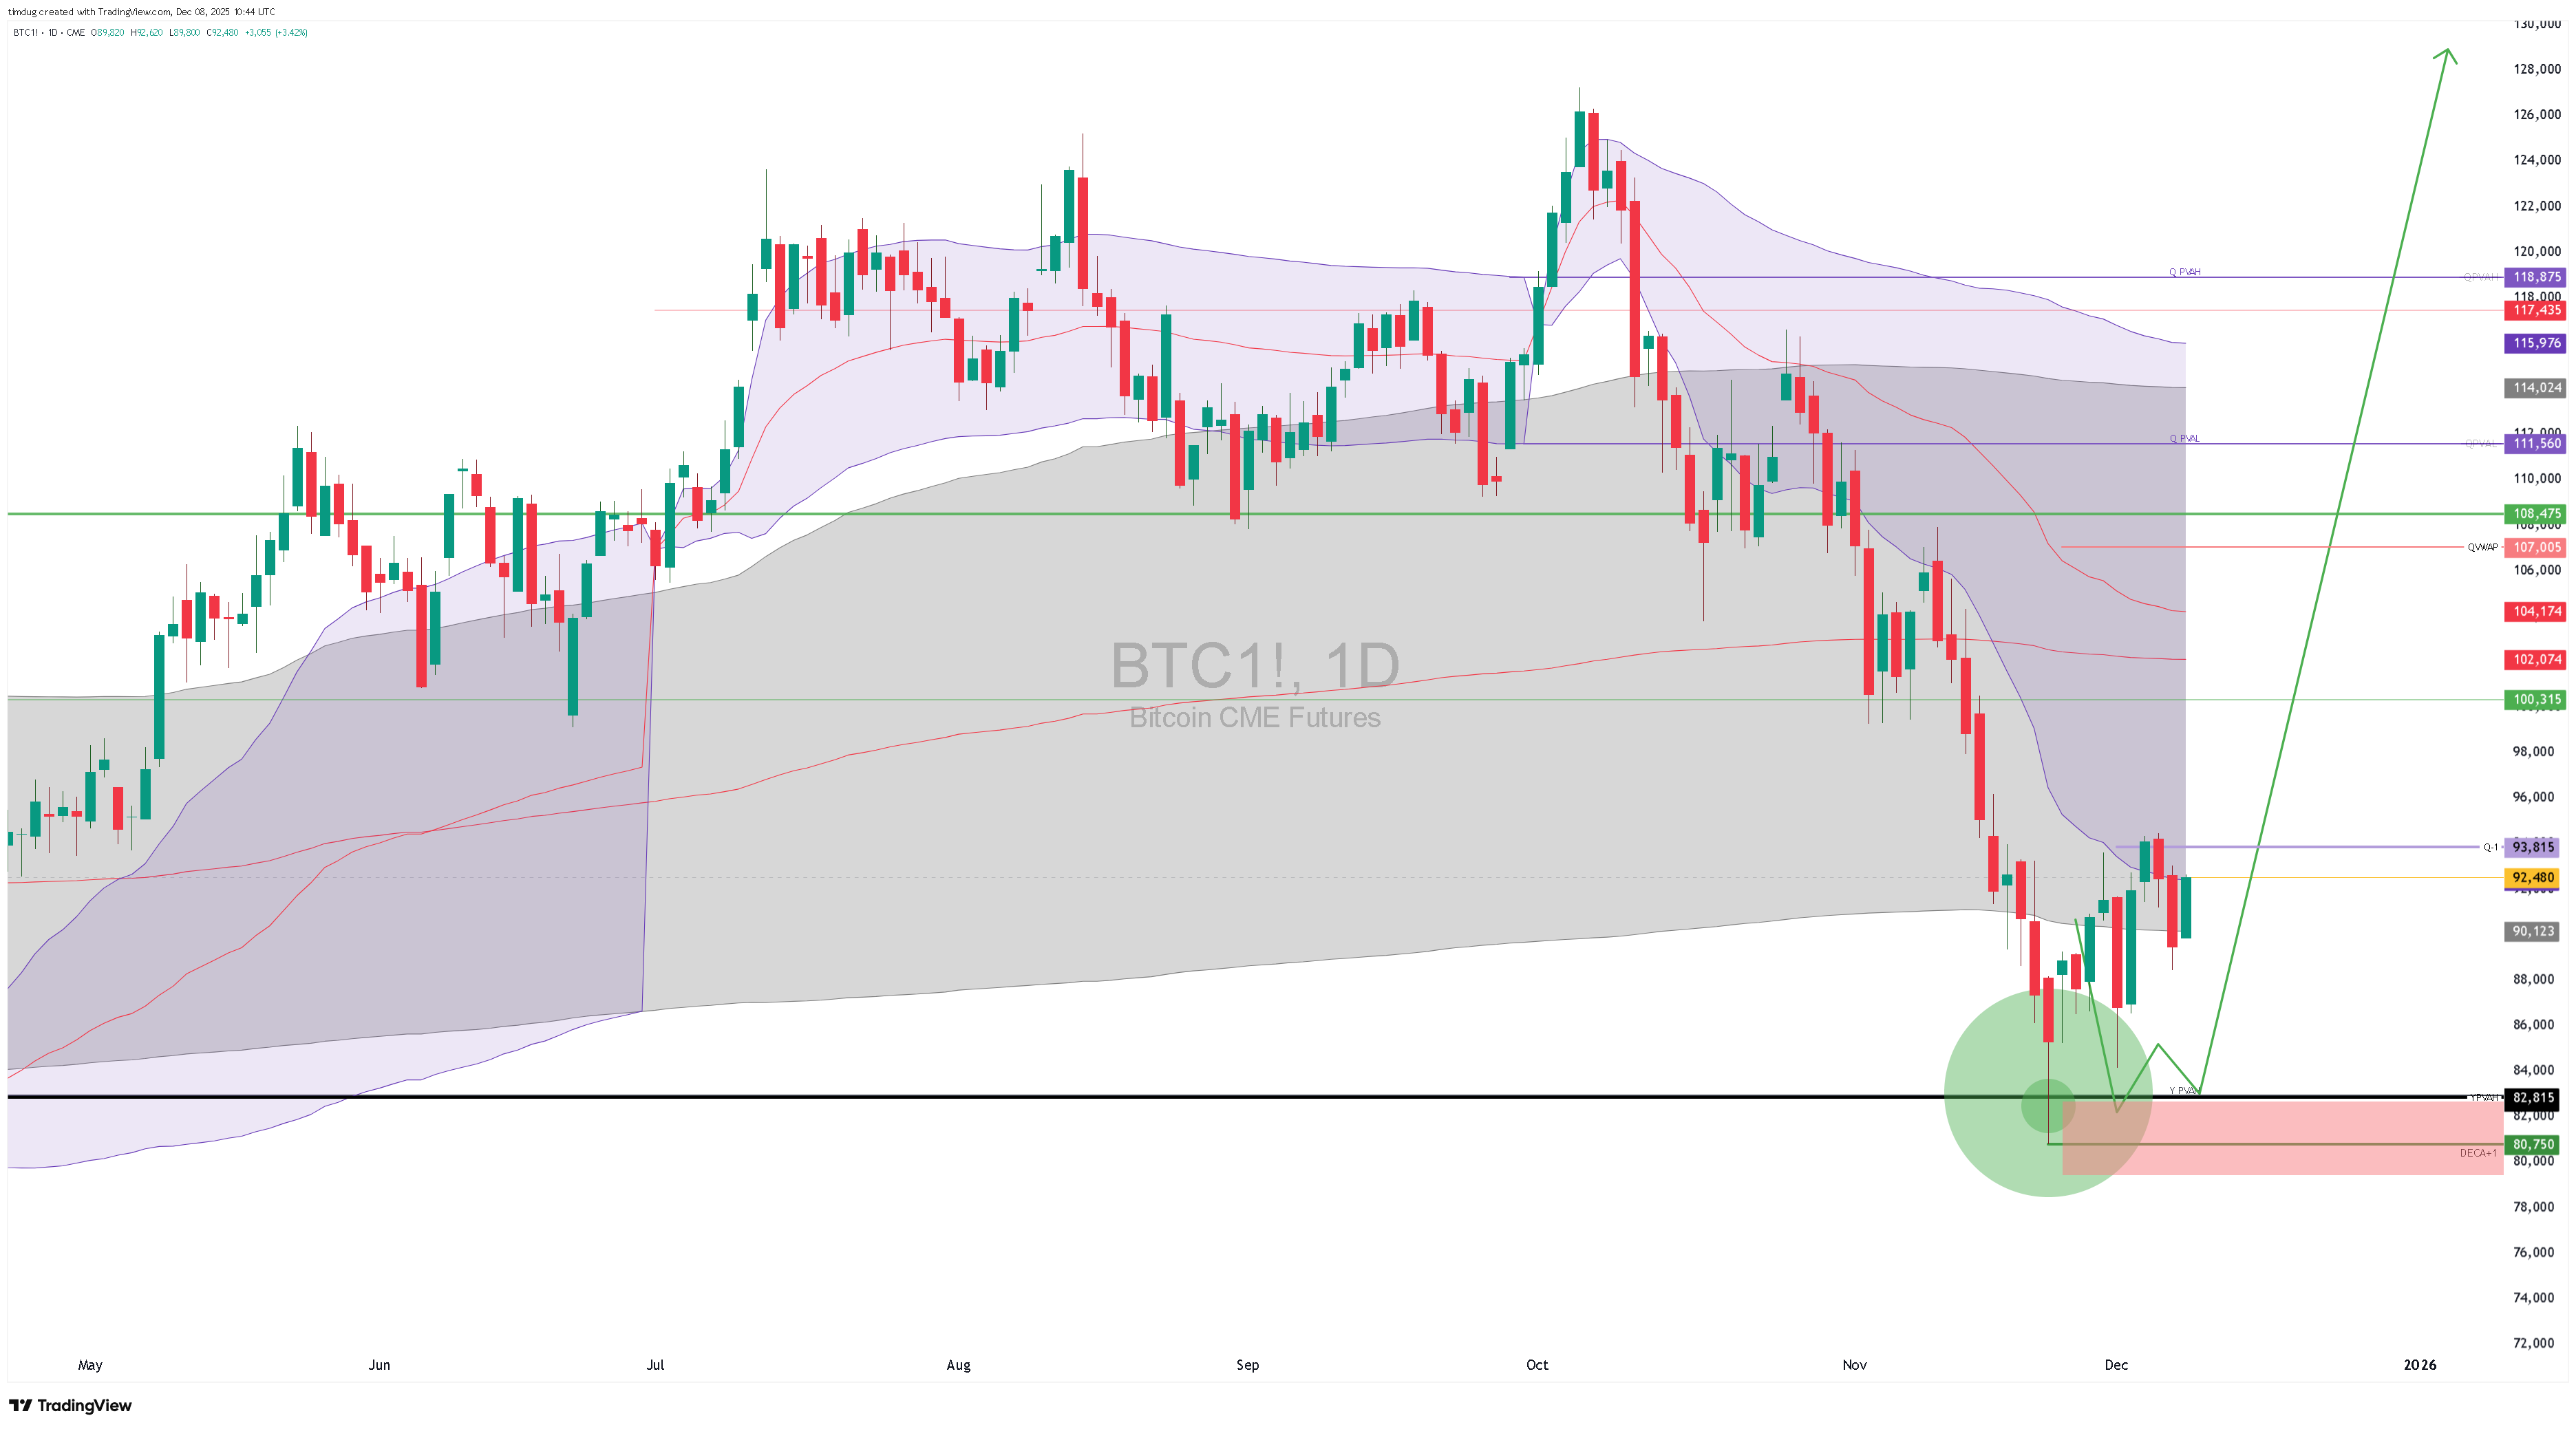
Market 2: Bitcoin CME futures
Symbol: BTC Z26
Structure: IB Up on Decade.
Setup type:
Bias: Long medium to long term.
Notes: Remember 10 trading sessions ago when the sky was falling on Crypto- that was the dip. This is a continuation trade on the long side that I issued over the last 2 weeks. Just making sure that people are trading that this trade is still holding the decade up -trend. Stops for me would be below the local low at $87,750
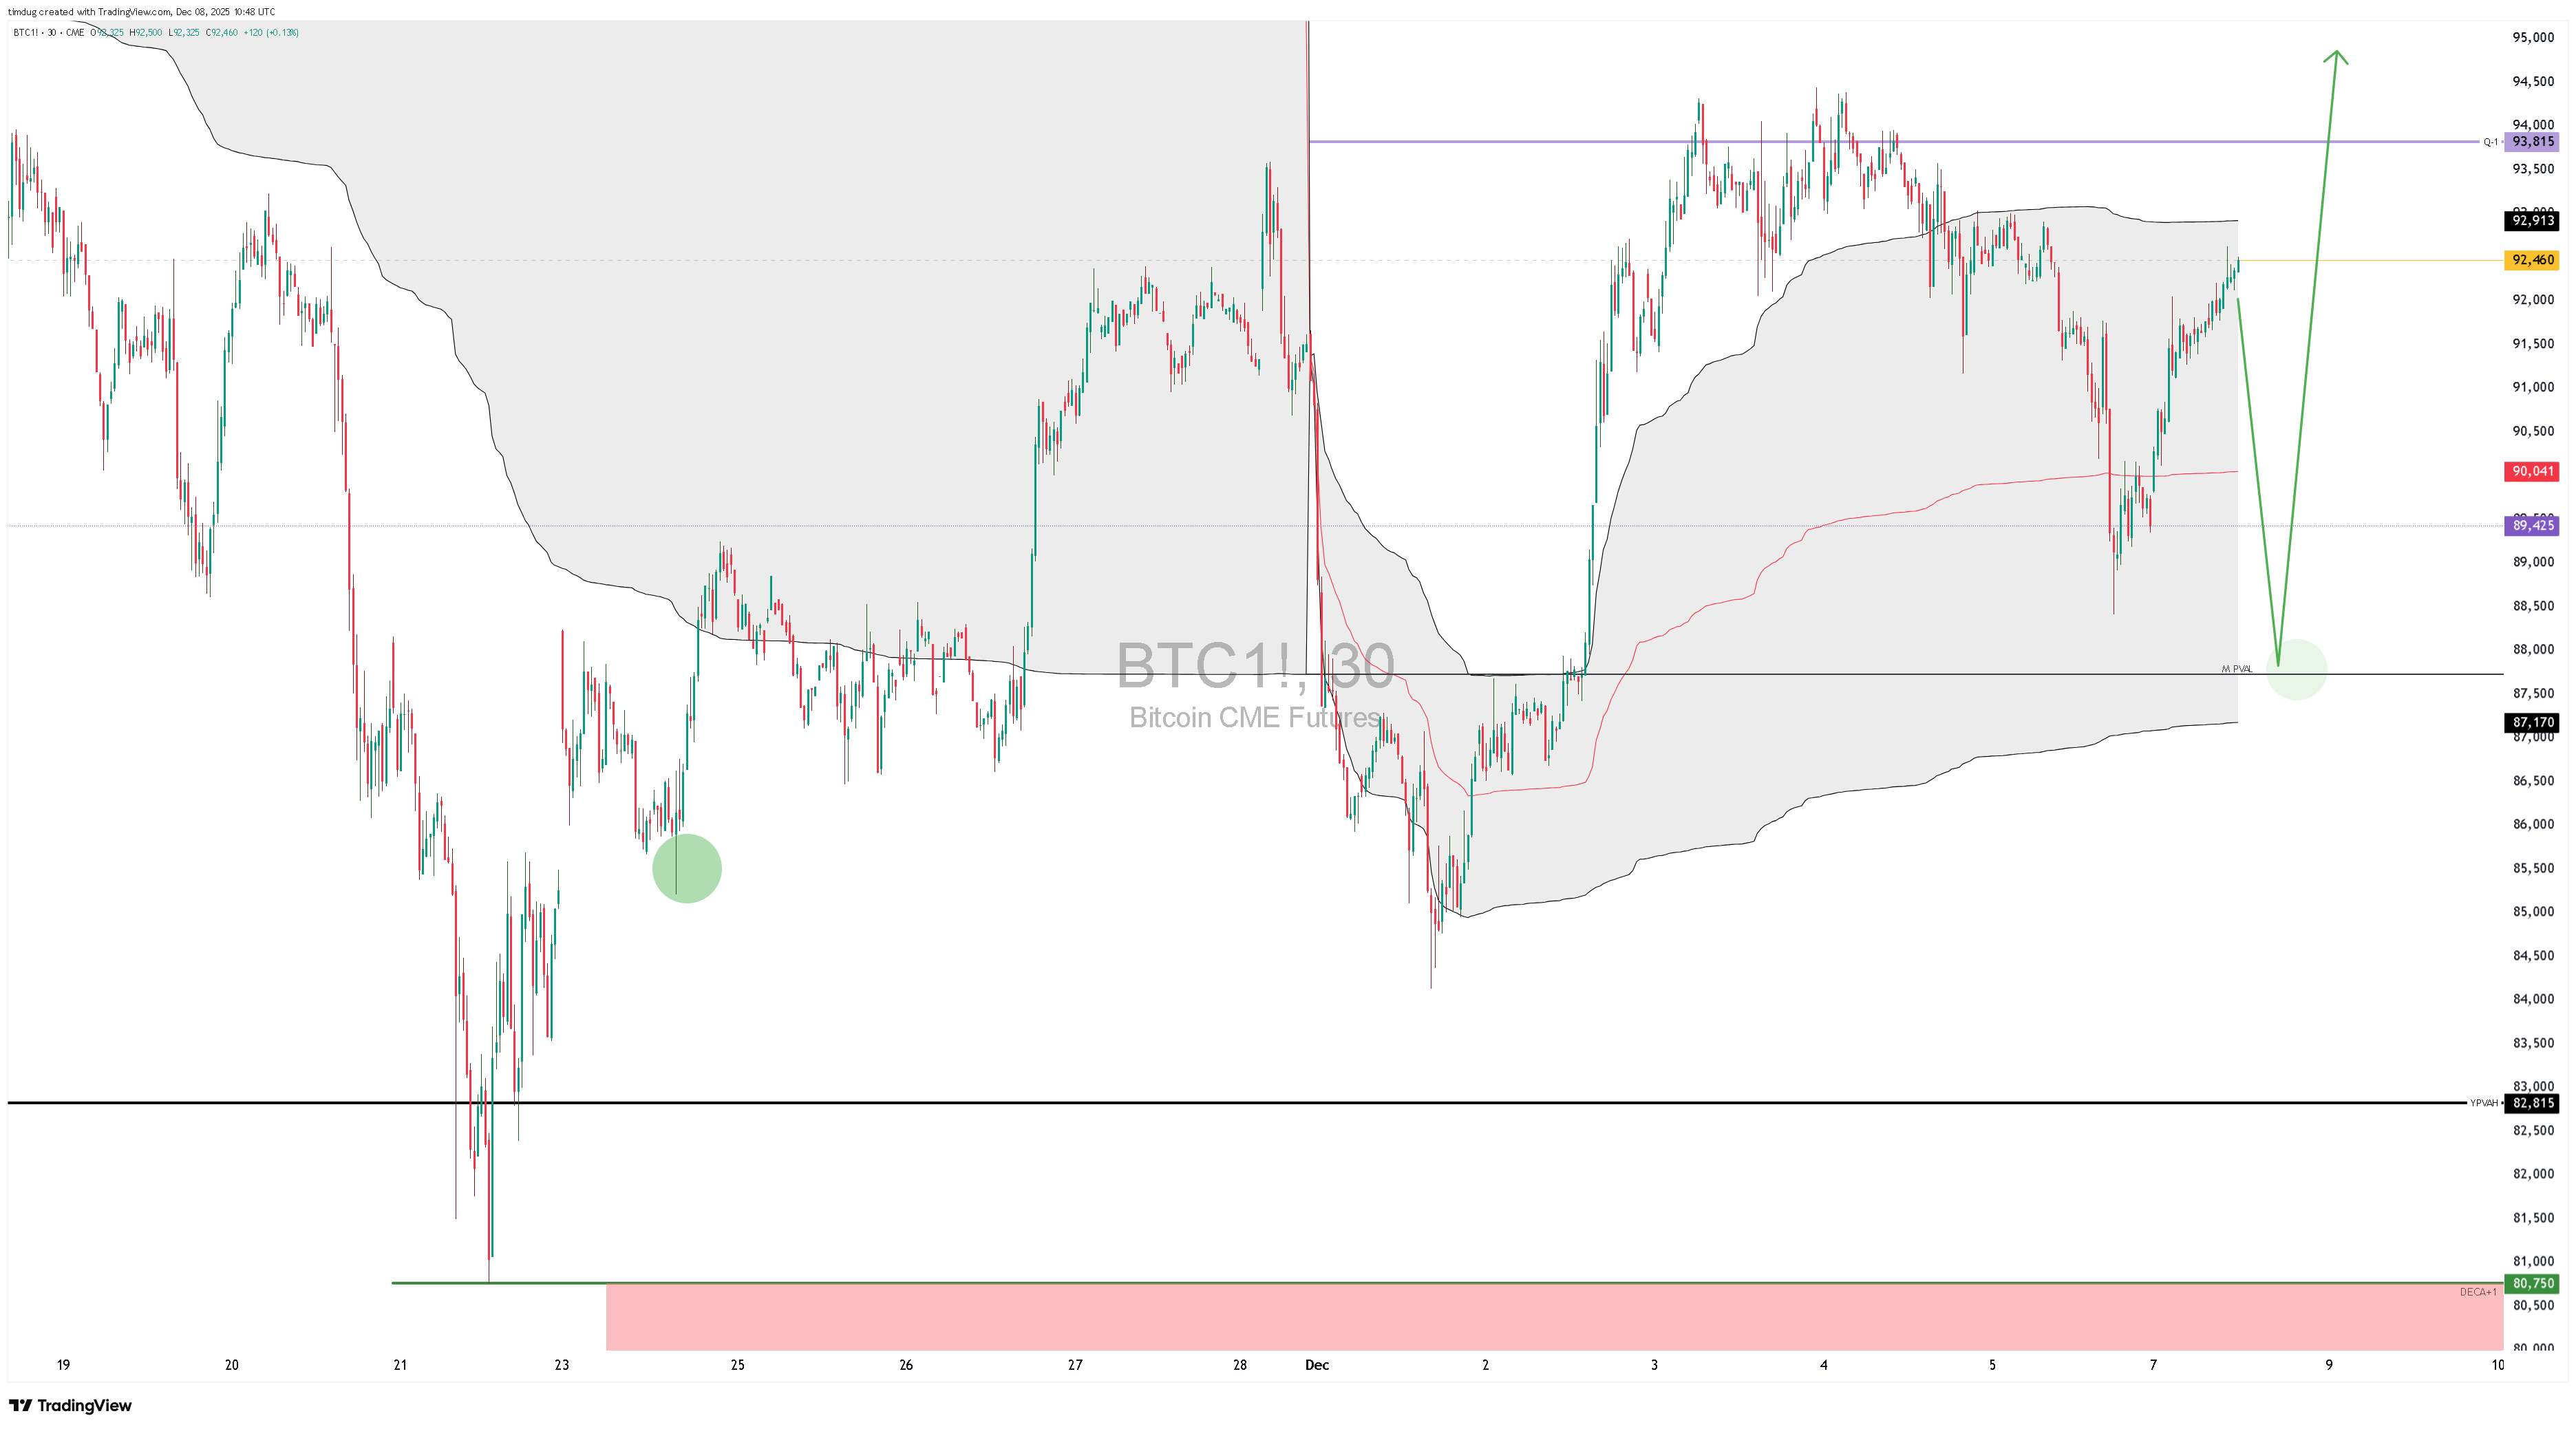
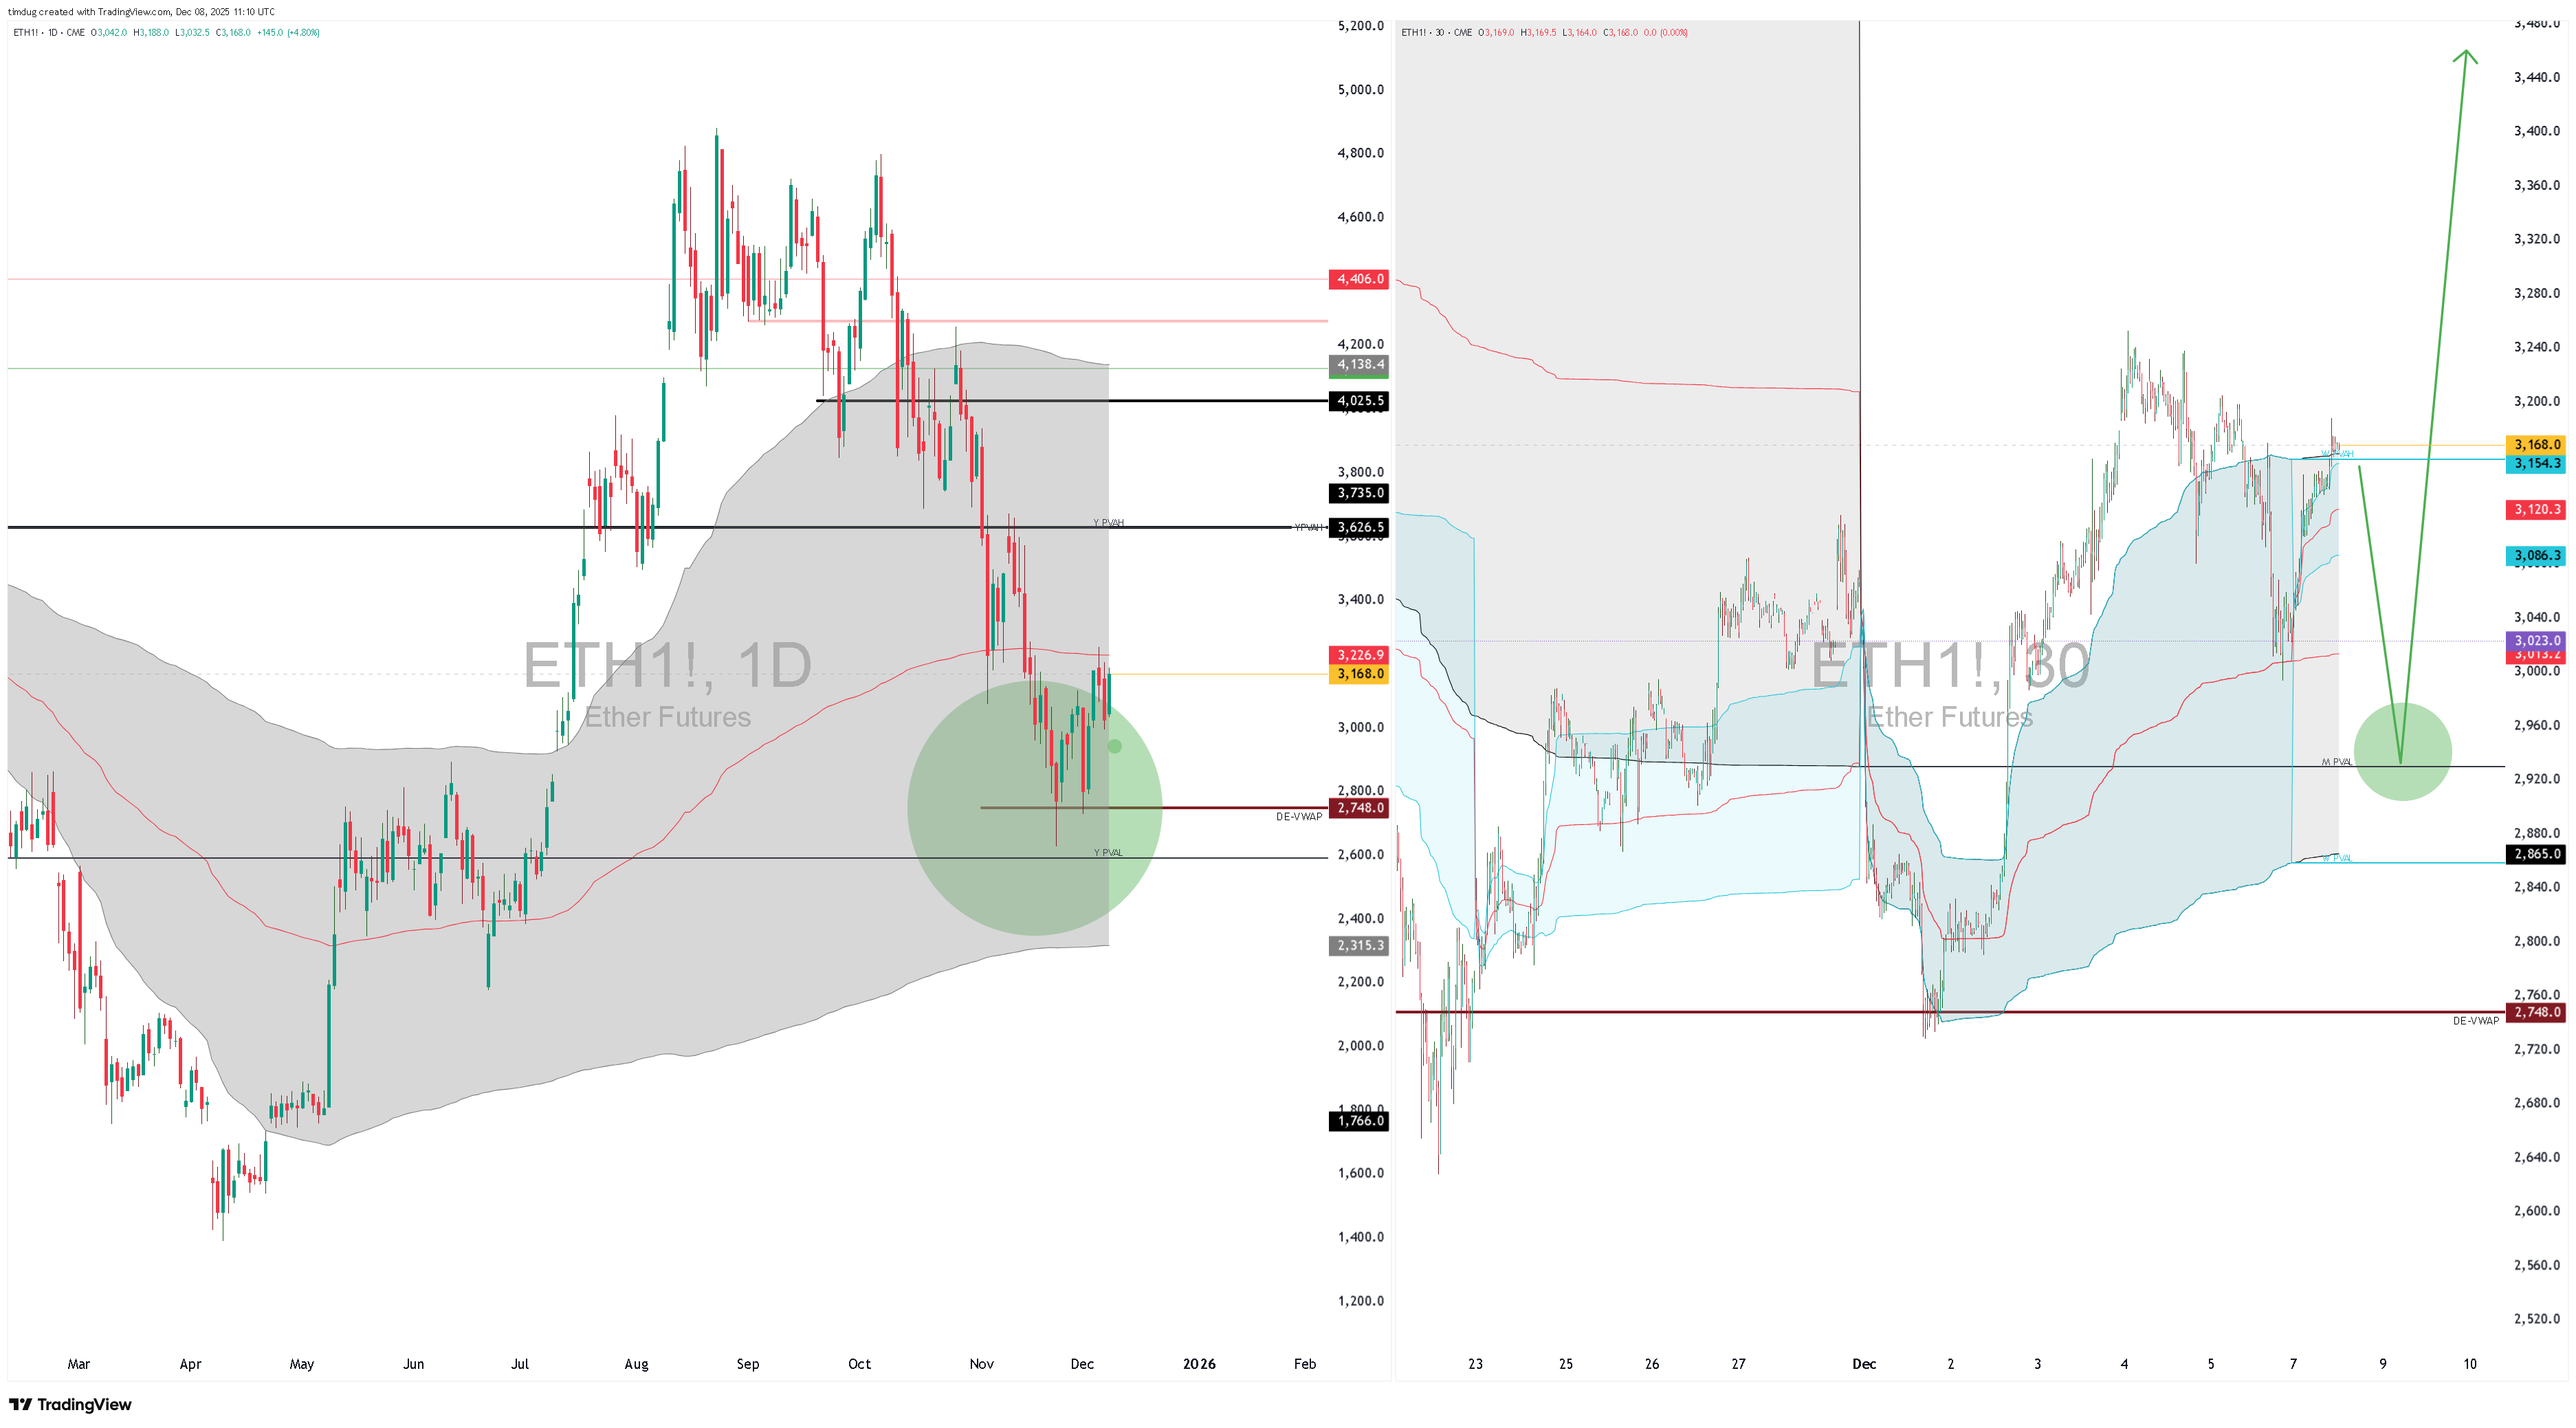
Ethereum: A compelling long picture on ETH also. Stops below $2600
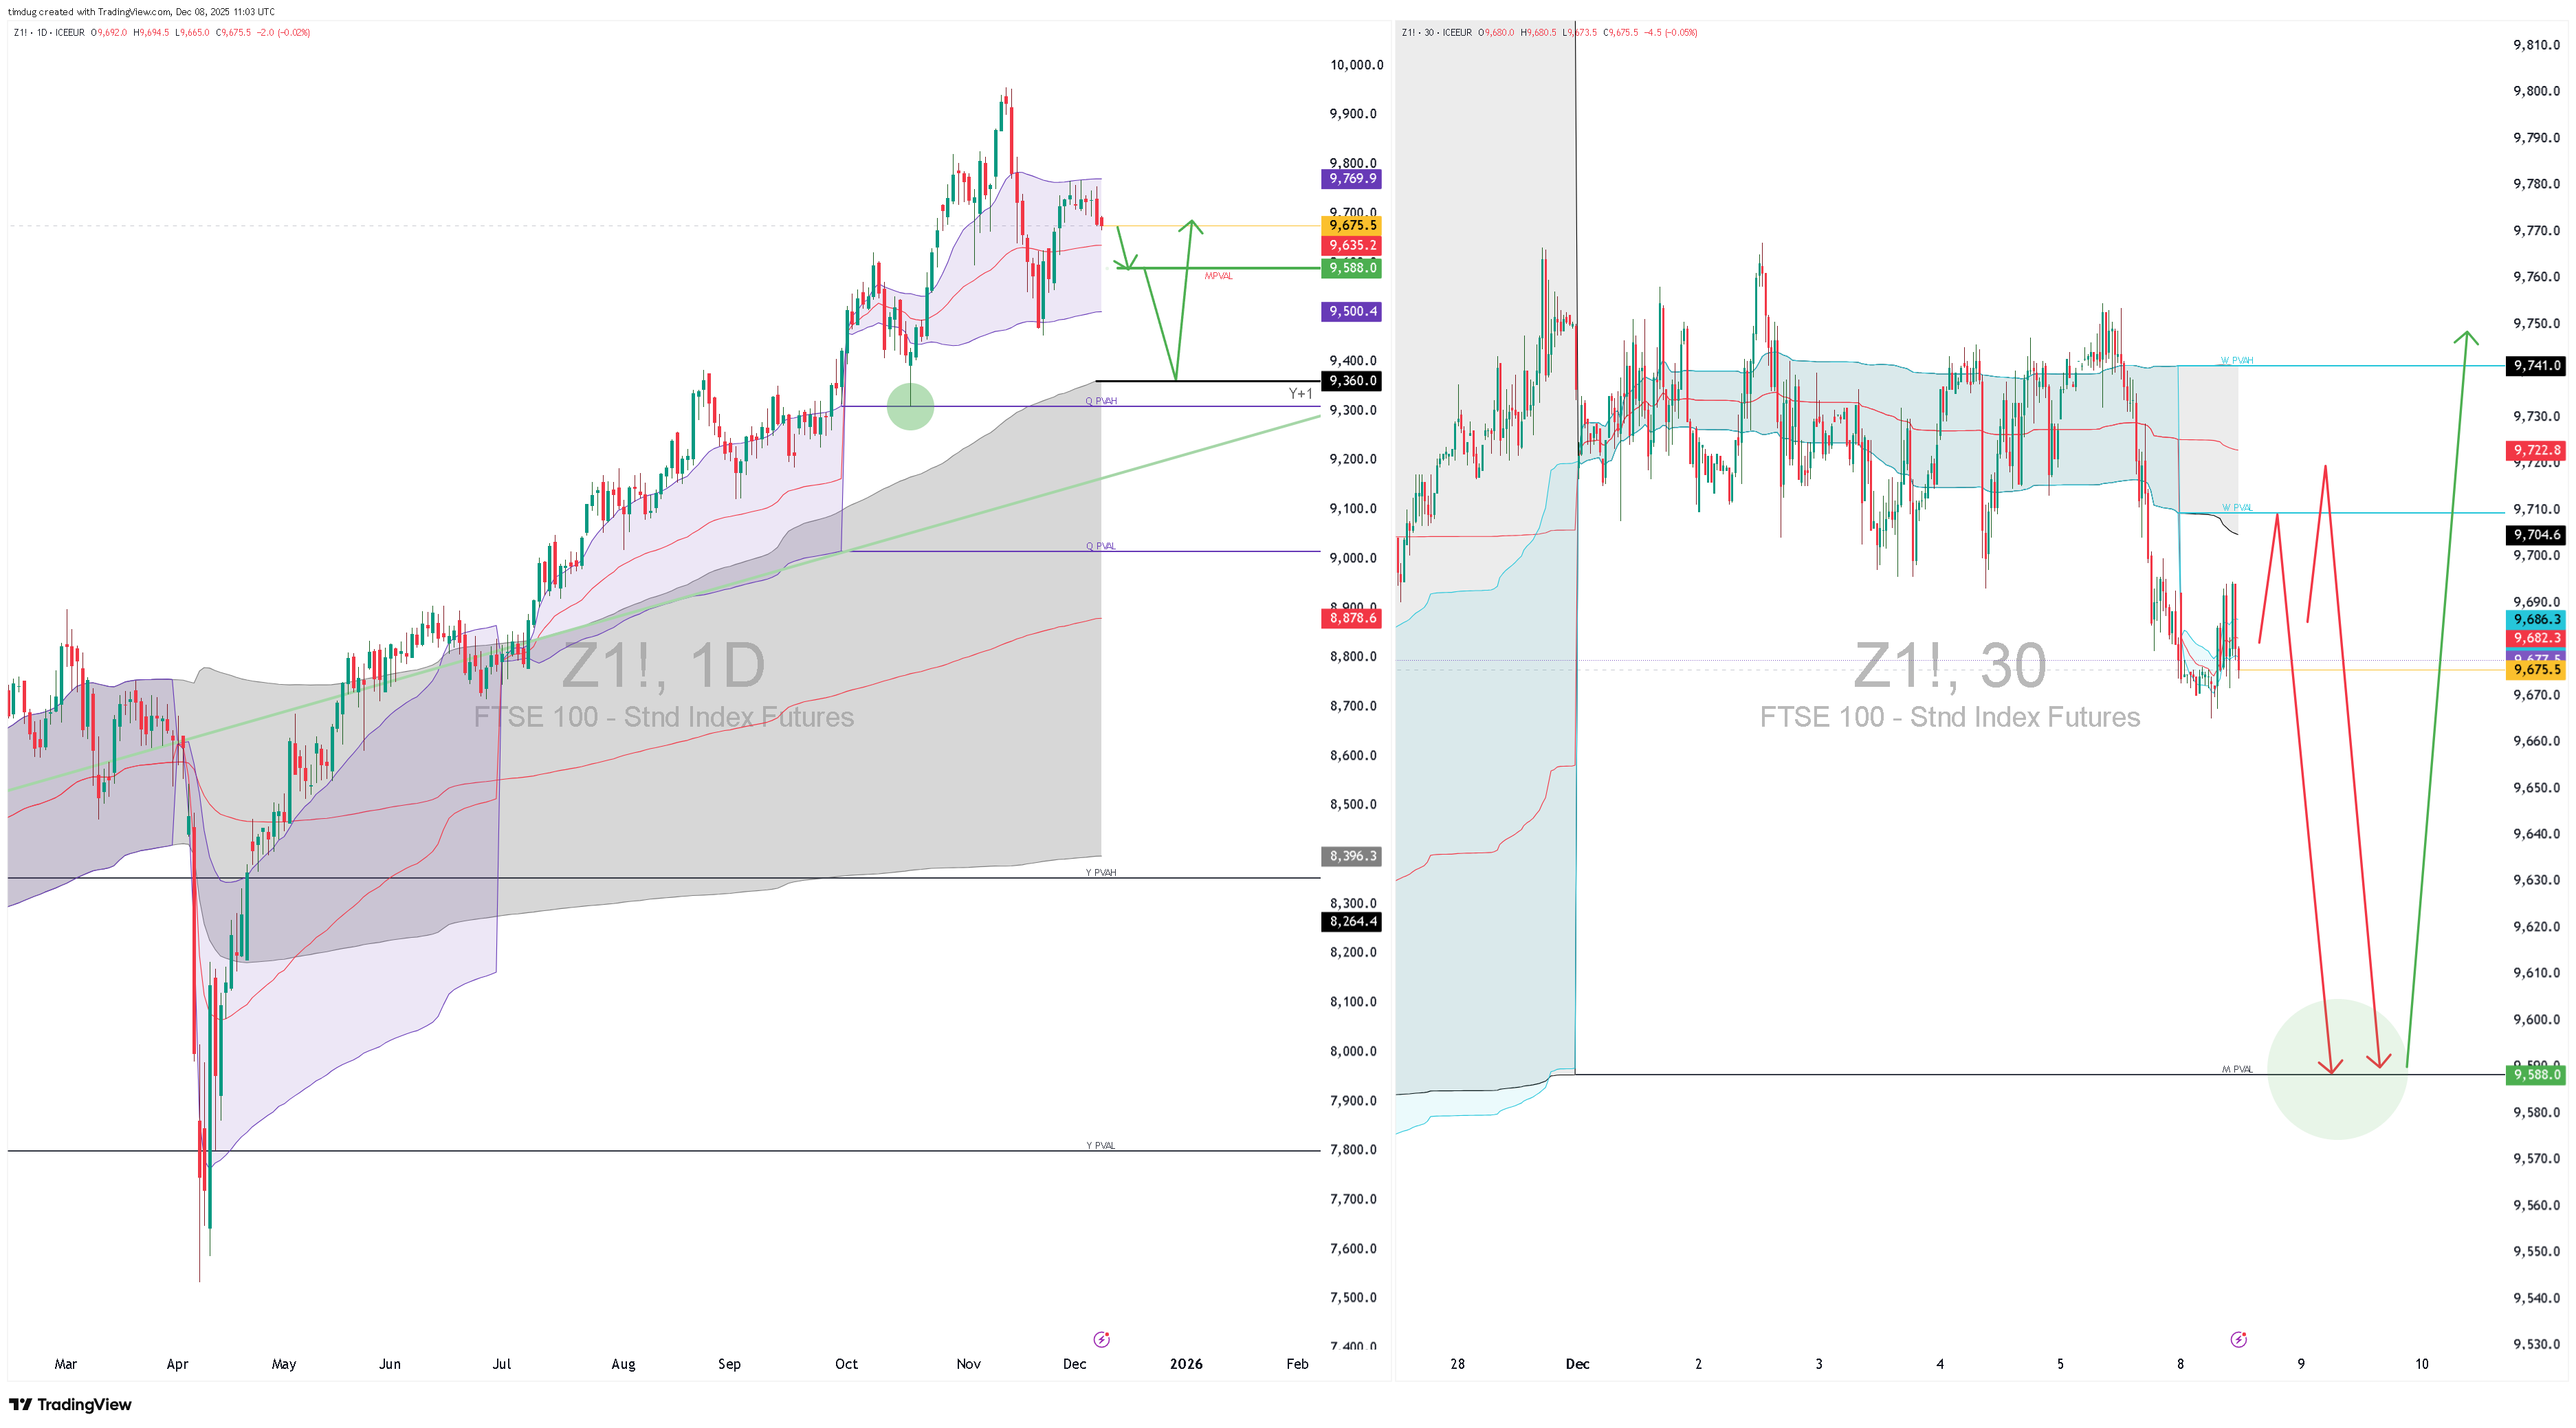
Market 3: FTSE London Futures.
Symbol: ZZ2026
Structure: IB Up on Decade, Year and Q. IB Down on week.
Setup type: IPB Long from MPVAL. Stop below. Then look for longs at Y+1
Bias: Short -short term/ Intraday. Long, medium to long term.
Notes: For the longer duration trade, buy the first pullback to Y+1.
Market 4: Silver futures
Symbol: SIH26- Most volume seems to be trading there.
