

Powell under pressure!
Markets imbalanced down

In this report ES, YM, GOLD, BITCOIN, OIL.
No earnings of interest out of US this week.
What a week we just had! An economic set of data that will now keep Jerome up at night. He may have left it too late to act. I think he will be fine though.
The title of last week's post ‘’Everything is fine’’ was a good marker indeed for a point in the markets where it was poised to turn dramatically from all good, to not so good. The dips to the SP500 Q-PVAH $5439s were indeed bought on 3 occassions. What then changed was a small collection of elements.
1: Japans Topix index was getting hammered from a BOJ 0.15% Rate Hike. Current rate now 0.25%. Hawkish. The index saw the 2nd largest selling day in its history on Friday

Thursdays US manufacturing data came out very week, slipping further into contractionary territory i.e. under 50. You can see by the numbers below, that we have been contracting and we slipped further. Added to which, there was a jump in prices. Not good.
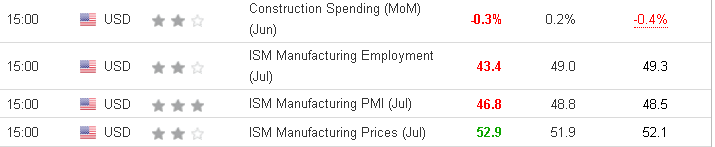
3. Friday: NFP Left nothing on the pitch. As you can see below, a miss on headline and private payroll figures with a nice bump up in the unemployment rate.

So this was enough for the market to say adios and down we went across the equities board.
4: On Friday, Warren Buffett, The GOAT, liquidated $86billion worth of Apple stocks. He also has been holding a phenomenal amount of US treasuries. To put his book in perspective. The US Fed holds $195Billion, Buffett holds $277 billion of T-BILLS.

So net net, what does this all tell you? Well, if you believe in the 4th turning, we are heavily into the start of a mega washout in the stock market. One that could eclipse 2020? Who knows. Just don’t go against what you see Warren doing.
Enough……… To the charts we go!
S&P500 ES U24
This week, I am correcting my ES chart data from using historical charts, to intraday only charts on the daily bars. Half the market uses Historical data for their daily bar charts, however there is significant amount that also utilises intraday only charts. If you trade more in the intraday, I would recommend using Intraday only for your daily charts. If you are a swing/ position trader, I recommend historical day charts. There is a difference. It means our QPVAH moves lower. You will see that in last week's report which used the historical data, that the market indeed saw the Q-PVAH then at $5439.75. With 3 strong rallies coming in from there. It has now moved to $5412
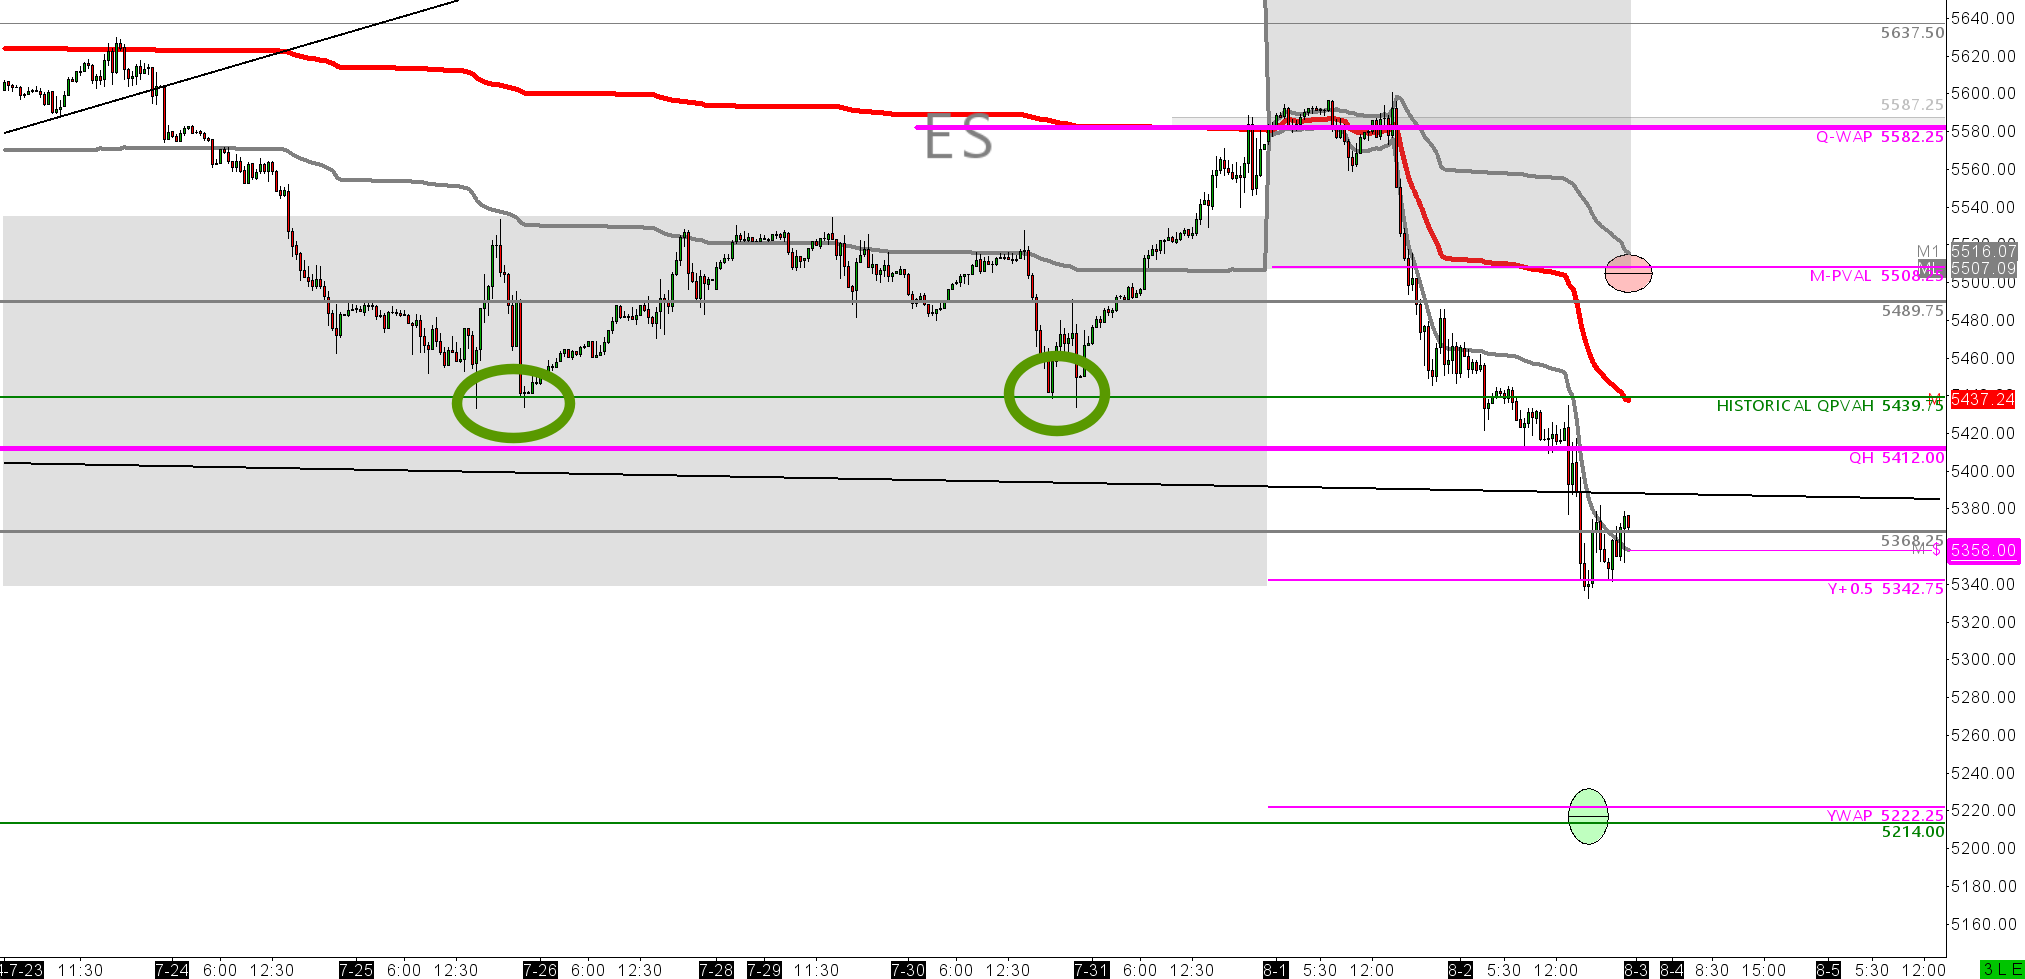
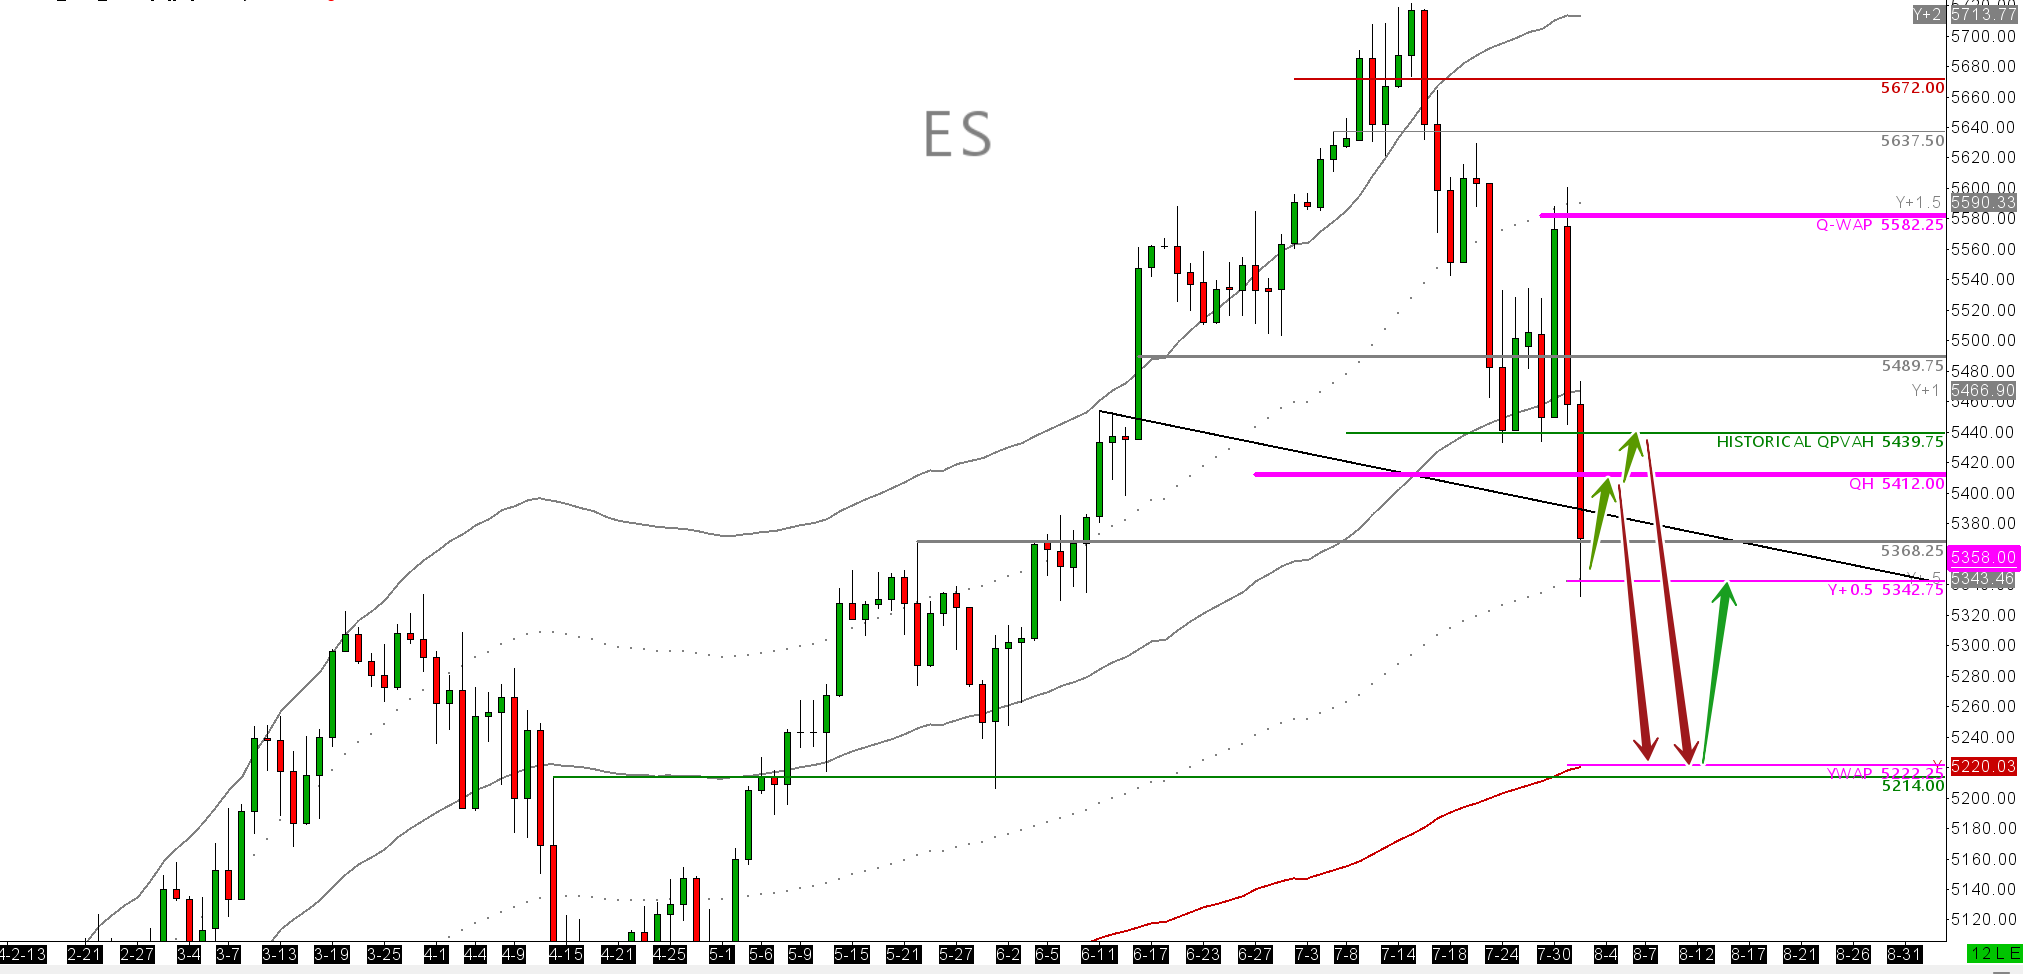
Okay, so we did pretty well last week. This week and indeed this month will be interesting. Based on the yearly vwap, we are rotating back down on the year, selling came at Y+1, which is what we call dynamic value high. It is dynamic i.e. moving high of value for the current year. Sellers here will want to at least take us back to Y-VWAP $5222.25 to reload more buyers. The line in the sand support of $5214 confluent. Pay attention should we trade here. Unless its the launching of ICBMs on geopolitical escallation, we should bounce from there. Remember, Y-VWAP is the average price paid for ES contracts so far for this year. The question when we trade there is: Do people want to buy more at this cheap price right now? Or do they want to take risk off the table and we need to trade to cheaper grounds? I will be updating live on this for paid subscribers when we trade there.
However, I think there is a bounce in the market before we trade YVWAP. We need to load up more sellers at the Q-PVAH to act now as resistence $5412.00. The market may even want to test the Monthly PVAL also at $5507. So look for weakness and shorts from MPVAL.
DOW JONES YM U24

The Dow has put up a good fight over the last couple of weeks, despite ultimately getting dragged down on bad data. We saw a small bid as expected coming in on the QPVAH $39,522 about 90 mins after the open on Friday. Is this going to hold? It should do. HOWEVER, I don't think that we have the right type of market ahead next week in order for us to rally much above the high of 20th March 2024 $40,316. I currently see that being around Monthly VWAP and a spot where sellers will want to put more supply into the market. So I like shorts from there if you want to be short. There is also potential for sellers to reload the M+1 $40,783. Remember, there will be a lot of value hunters in the market come the reopen this evening. Try not to fight them. Wait for them to get exhausted at areas like M-VWAP or M+1.

Gold GC Z24
What is there to say, Gold crushing new all time highs and last week was a clear indication of further confidence in derisking DXY. Gold came back to support Q+1 $2455.1 closing the week supported above. This market can rally higher from here, however it would be best to buy cheap, rather than take part in buying high, relying on the greater fool principal.

My recommendation is to wait for contact with the Year+1 for a reload from buyers.


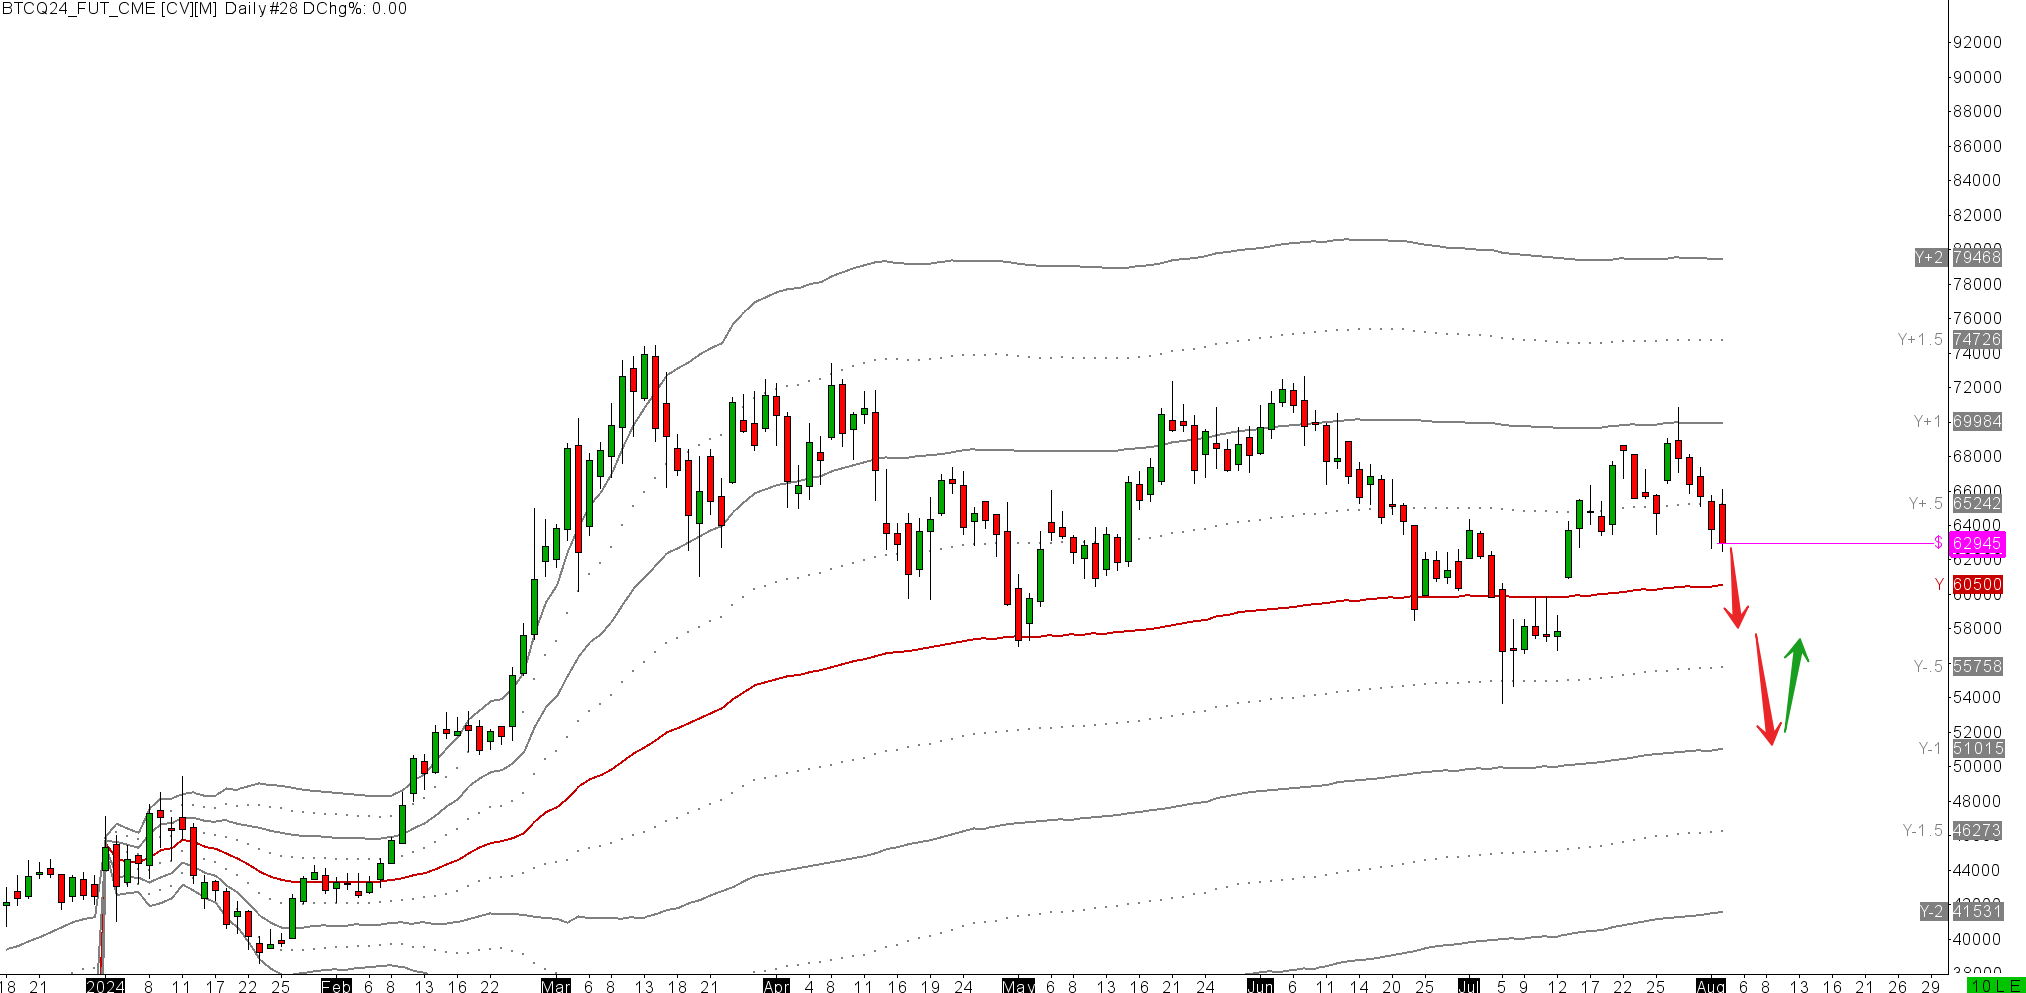
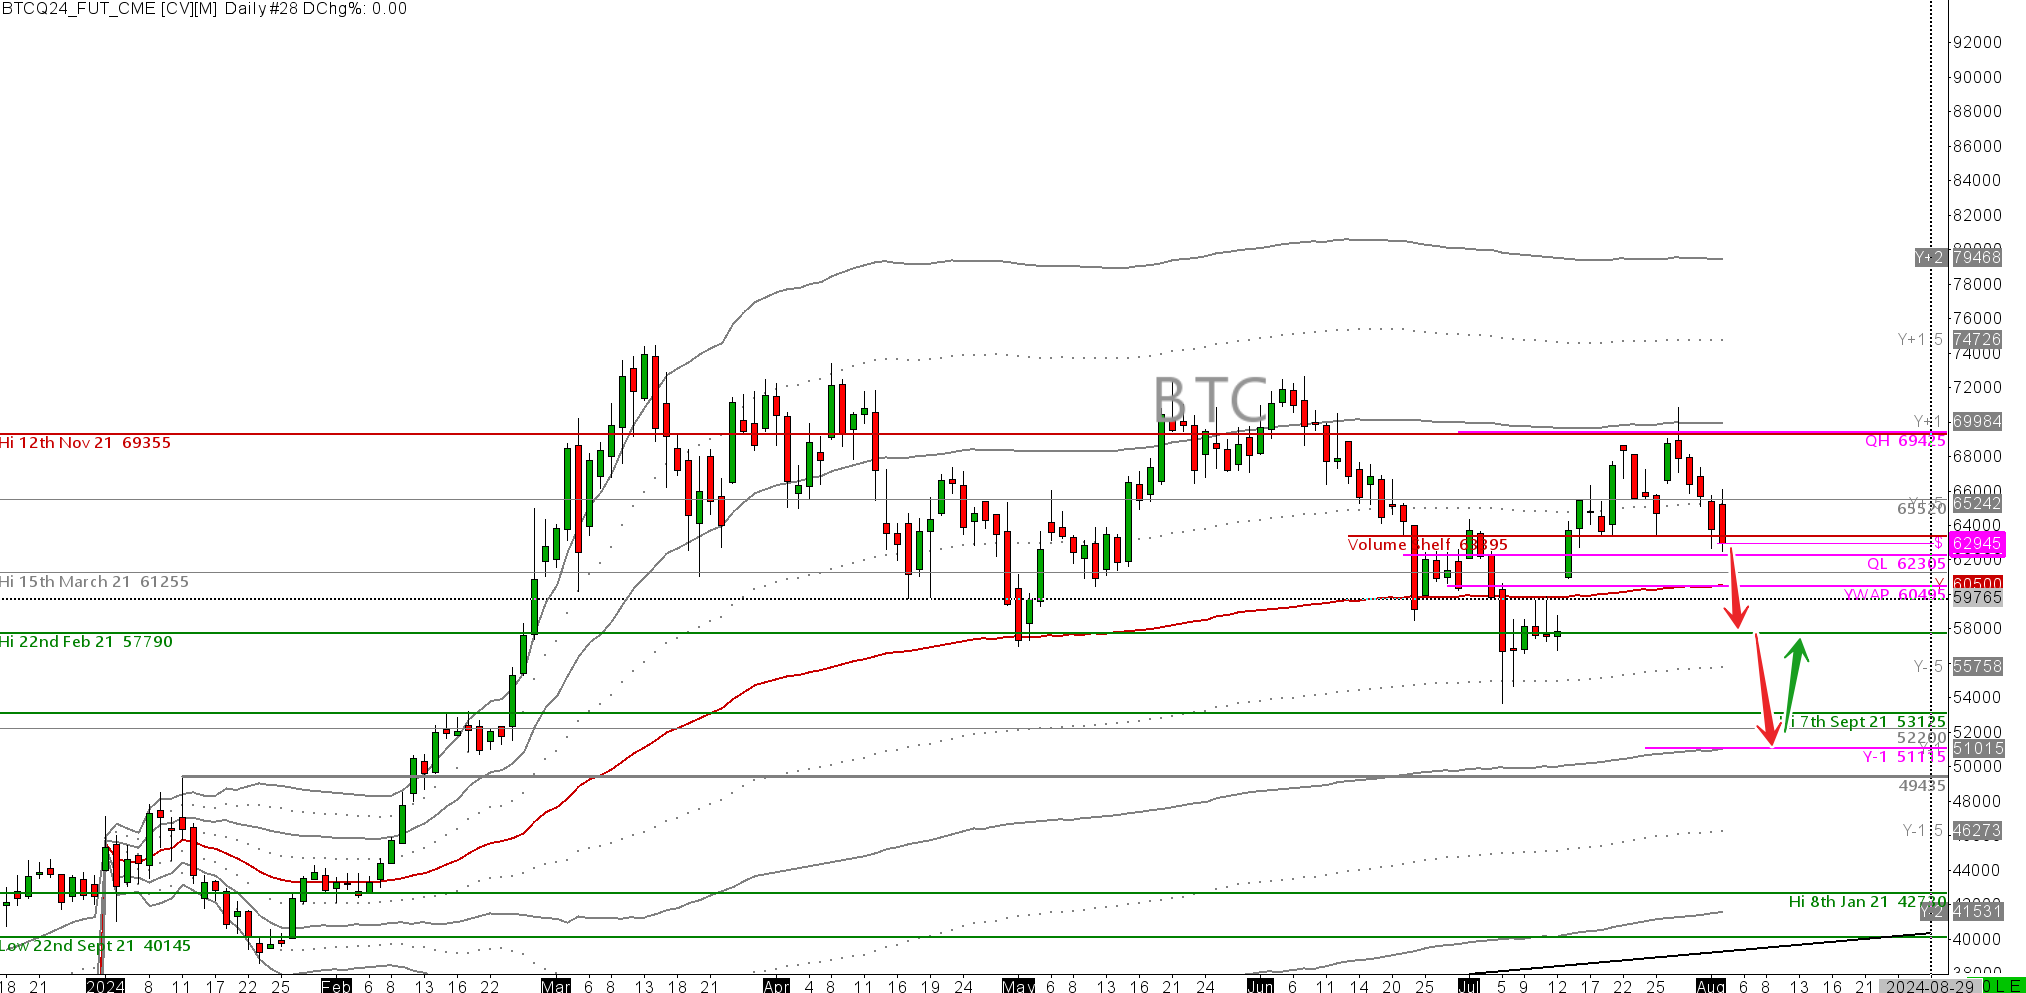
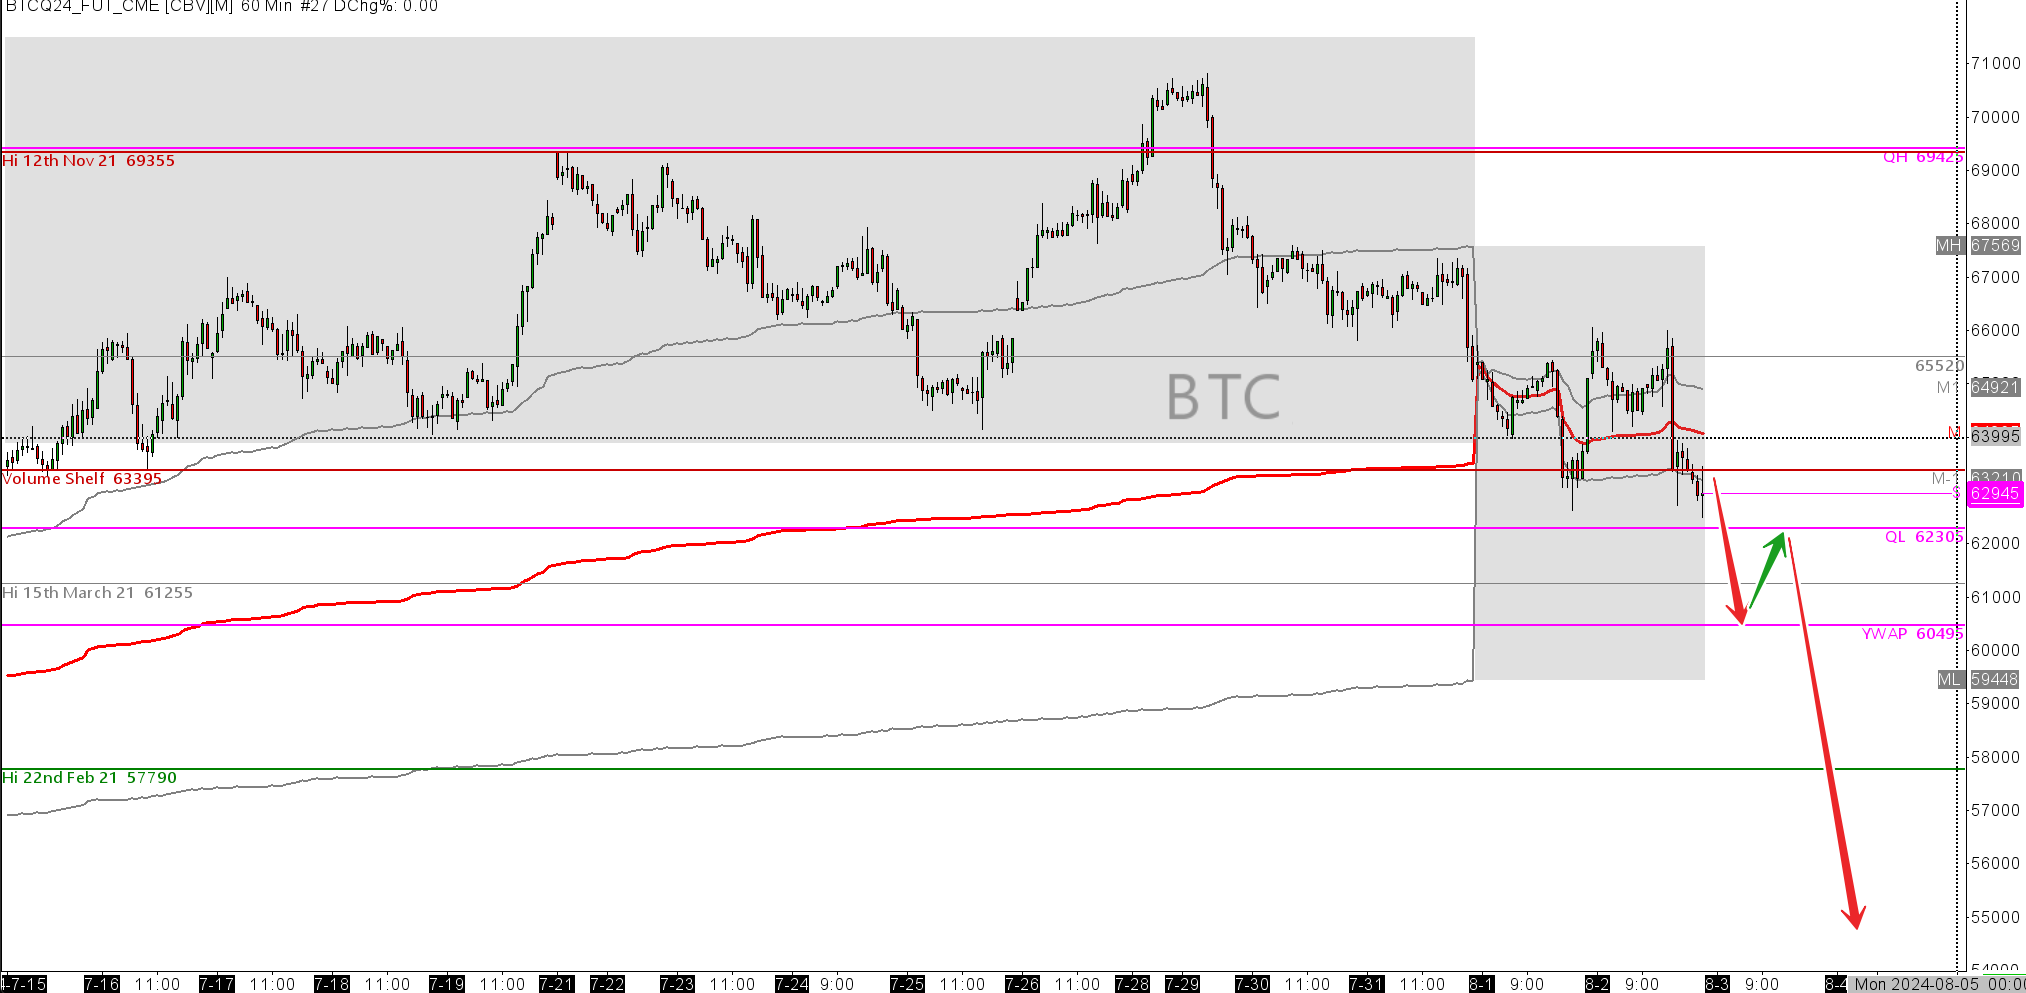
BITCOIN BTC Q24
Bitcoin is under pressure with sellers, like in ES, piling in on the Y+1 $69,984. They will want to take out Y-VWAP $60,500 and put it again to buyers there. I dont think they are going to be there though. It is always difficult to forcast how the weeks geopolitical will shape up, but from last week, we would normally bid up on poor economic data, however this failed to transpire last week. Time and time again, we have failed to see BTC act as a risk off assett. Why would it be different this time? However, that said. If we see a DXY dropping off a cliff, it would be hard to be seller on BTC. The only thing I would be confident on is that we trade the MPVAL $59,448 and find some level of bid there worth a small day trade. However I would be seller on a pull back to MVWAP.

WTI OIL. CL U24.
Okay, time for the big show. While the world awaits an Iranian military response, oil is receding to prices last seen in May. As marked by us in the room at the time on Thursday. The market is continuing to sell down, as per my report of 3 weeks ago in this report.
I see a very limited further downside for oil now- just my opinion. We are about to complete the trade on the major pennent as per Daily chart here. It is also confluent with Y-PVAL. In the last report of this month, for paid subscribers, we will be looking at some of the very profitable oil spreads that usually start the first week in September. I think we are setting up nicely for this seasonal spread with such low front month prices.

Anyways, I like longs from $72s and YPAVAL $71.57s. We simply do not have the micro or macro environment for sub $71s prices right now. If I’m wrong, well, it will be in a big way.

For me, nothing is ever right or wrong. What is to be gained by being right? Its about what you do with your best calculated decision. The outcome is out of your hands. We are simply here to OBSERVE, ORIENTATE, DECIDE AND ACT OODA Looping. This report should serve to help you observe and orientate. Have a look at a series of lectures I gave on trading psychology a while ago. Part 1 is just me. Part 2 I cover OODA Looping in depth and how to start to think and act differently when trading, Part 3 is with a high performance psychologist Crede, that I have done a lot of work with in the past.
Okay, thats it folks. Bank holiday Monday tomorrow in Ireland, so I will be off the desk. On Thursday evening, Im happy to say myself and Shelby will be hanging out with market Wizard-Jason Shapiro and his wife. So Ill be off the desk Thursday.
Keep it tight out there!
Well oil played out extremely well today. Will check in tomorrow on the rest