
Sea sick Oil sellers
Max ouching!

Quiet week for general markets ahead. Wednesday is Juneteenth holidays in the US, with electronic trade open. I expect pullbacks on Equities for the first half of the week at the least and oil to continue to force out ill informed sellers to reconsider overly bearish bets.
Highlights for the week will be Thursdays usual initial jobless claims. Markets will keep a close eye on this for any steep rise or drops.

Equities
ESU24- We have rolled on volume to the September contract.


It is clear to me now that we are trading more on solid economy numbers out of the US. As we get these diminishing inflation numbers like last week's great miss on CPIs and PPIs, yes the market rallys, however the market has been rallying regardless of the CPIs over this year so far. As the market anticipates rate cuts, things have looked good. Inflation has been steadily dropping and jobs and growth have remained strong. While we wait for this Fed reaction timeline ie. cuts trajectory (which wont come soon) the market has everything it needs. Good strong jobs data.
The worst thing that could happen for these markets now is that the Fed actually does bring in a cut. The thinking for this is that the market has already priced in the first cut at these dizzy heights. So the concept of buying the rumour and selling the fact will come to the forefront when this does actually happen. If you have any doubt, just look at what happens every time ES has to adjust to coming down from 6 cuts expectation at the start of the year now down to two this year, but most probably only one.
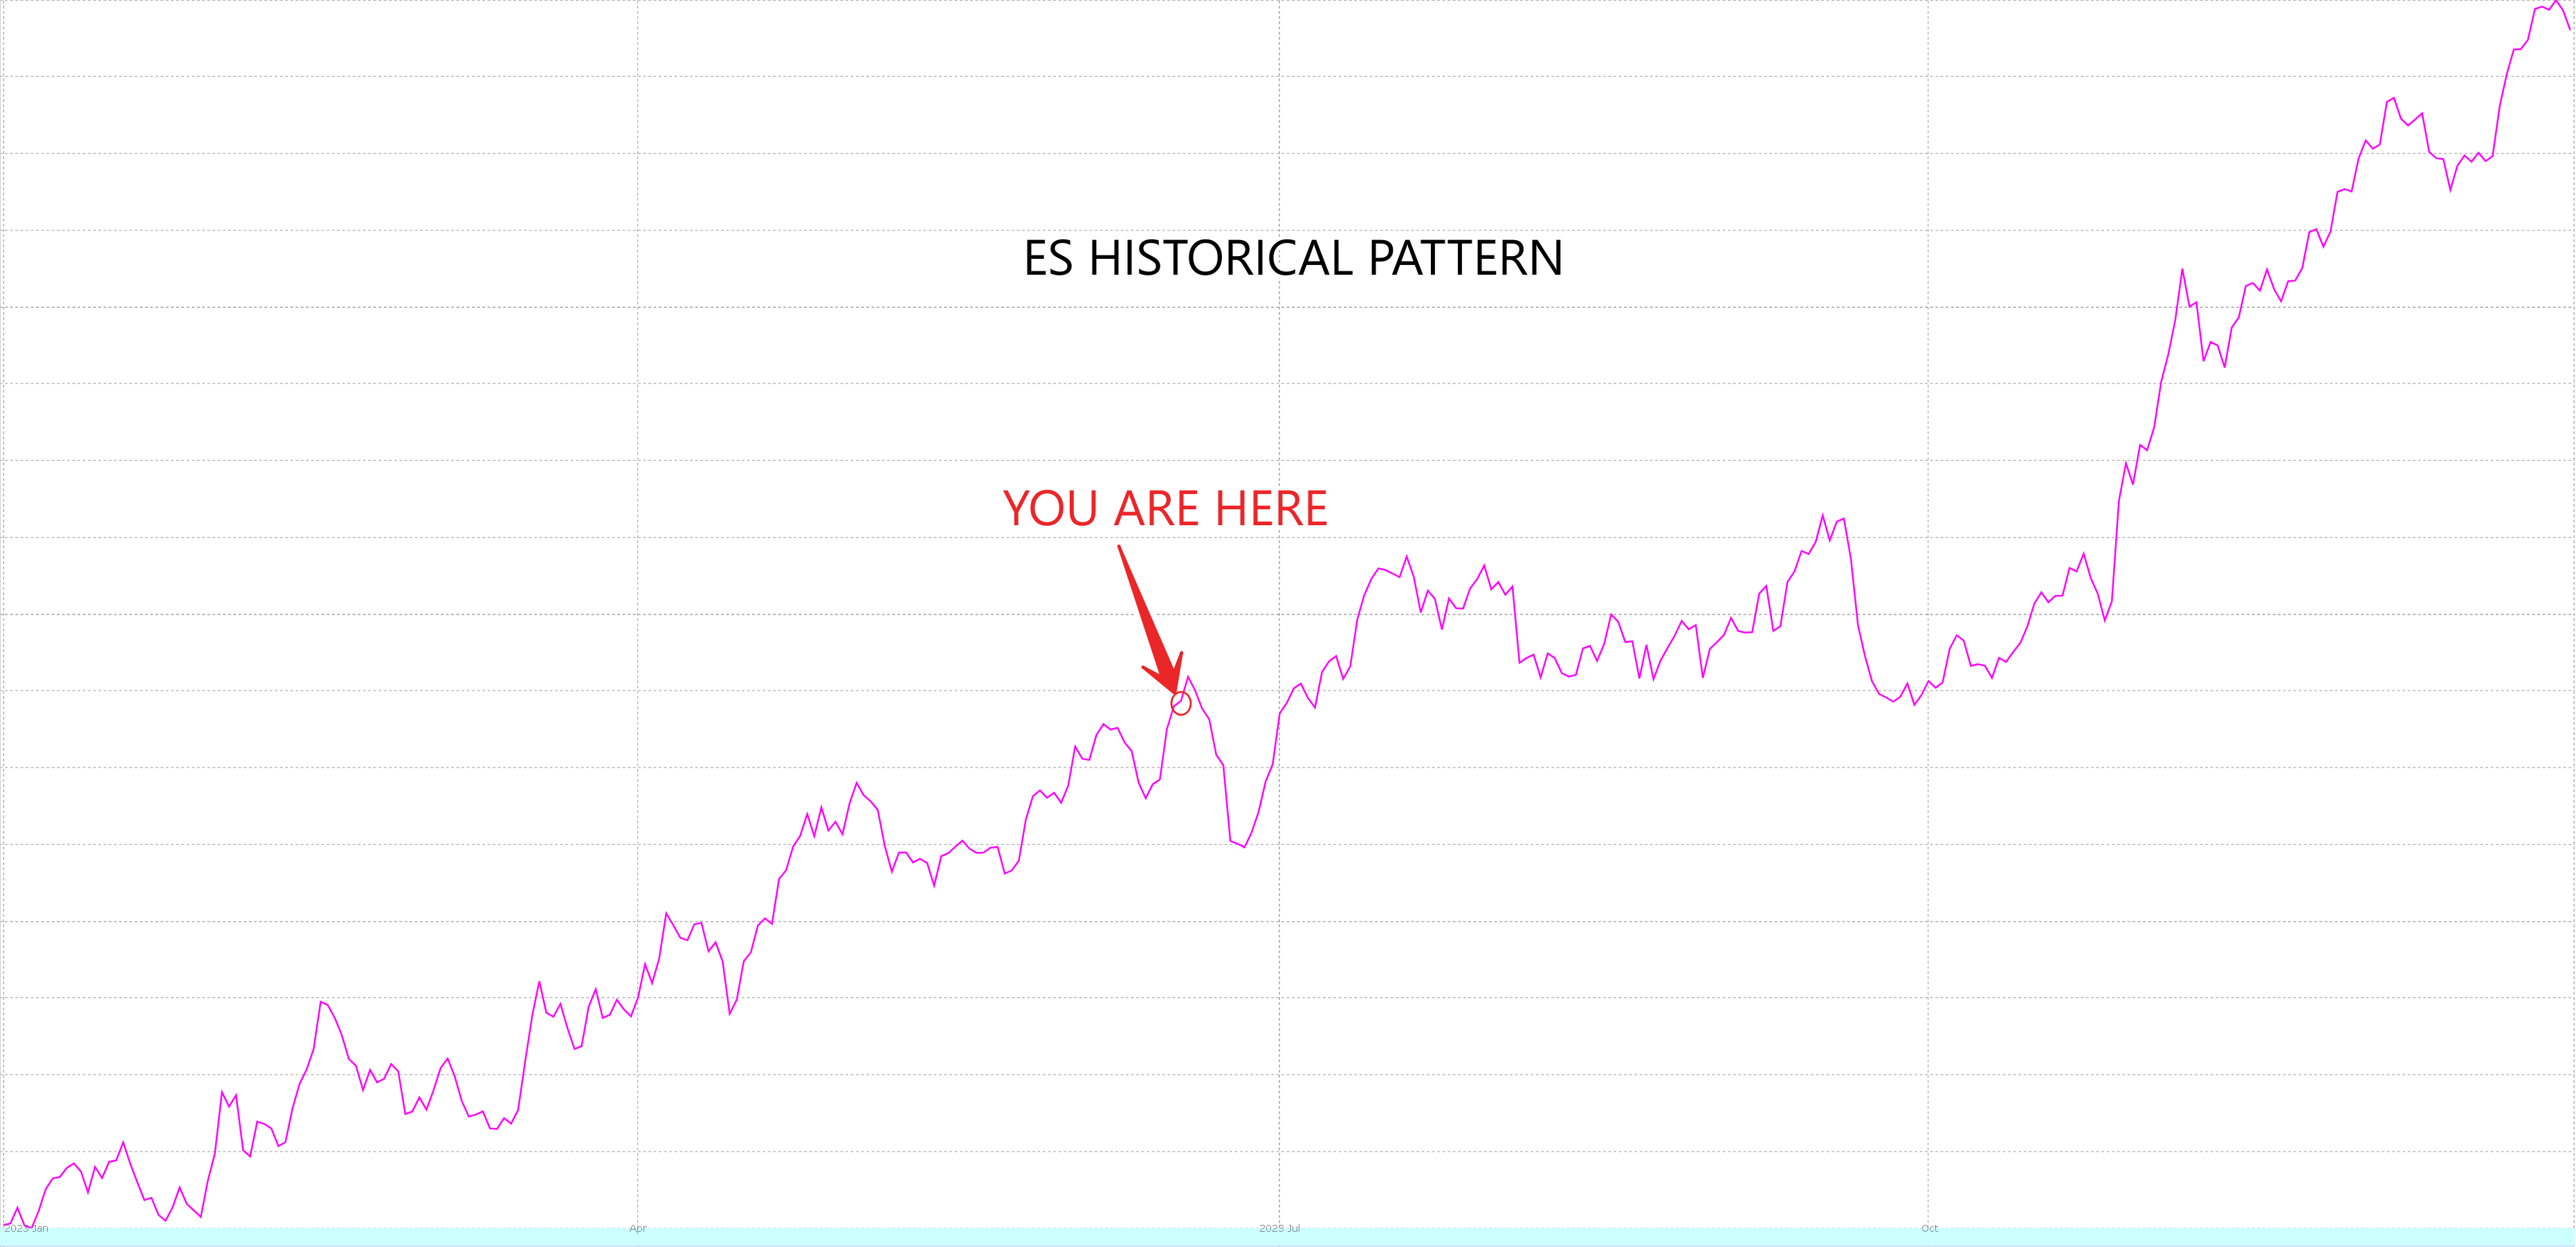
For reference, here is a chart of 30 years of lookback data from SP500/ ES and the seasonal pattern. We will have a pullback into the start of July, then we will rebid.
IN SHORT:
We go higher and pullbacks are bought, until we have an indication of Fed rate cuts trajectory. The pullback from today's high may be the top until we start to rally out of lows at the start of July. So based on 30 years of lookback data, act accordingly and don't outstay welcomes in longs at these highs. Buy dips around the last week of June/ 1st week July.
Okay, enough of this. How do we make money in this landscape? Let's get technical cause everything else is noise.
The Daily bars tell us very little other than we are at all time highs and extremely imbalanced up. If you are unfamiliar with any of the terms like imbalanced Up or Down, please refer to my last post about ‘Context’

With this, continued imbalance up requires a reload from buyers, so therefore, where is there a suitable place for that to occur?
Well the answer to that is in the monthly VWAP. Have a look here at how ES traded so far on the prior months PVAH. You can clearly see where buyers bought the M-PVAH $5322 and ran that trade to these highs. So the thinking is, that all staying the same, a pullback to the M-VWAP should be bought.Have a look here at buyers defending and reloading on the market open on Friday at M+1 deviation. A lovely spot to get long and ride it.

So looking at the Weekly and Monthly vwaps together, what you see below is what I think may happen this week on ES. A multi rotation sell, down to find M-VWAP and then rebid. PLEASE BE AWARE THAT MONTHLY VWAP Waill moved to a new price location through the week.
THE TRADE:
Long an Imbalanced pullback (IPB) to Monthly VWAP. This will be an intraday trade long. I won't be staying in this trade more than 2 sessions at max.
Short- As we print under the Y+2 5482S, then test it as resistance, there may be a great short to stay in as we come down to Monthly VWAP.

ENERGY
CLQ24 - We have rolled on volume to August 2024 futures.
Pretty clear that the overly large short positions in crude over the last week have now been handed the sick bag and exit orders as the market rallied back strongly from the OPEC+ reaction. Personally I thought it was overcooked selling, then on closer inspection, with the help of some analyst friends on Twitter, It became clear that the additional oil that is to come back onto the market in october has actually already been out there. Why? Because a lot of OPEC+ Countries have been over producing during the cuts era, therefore, they are not in contravention of the current group policy.
It's like, you only order 1 milk bottle delivery every week, but the milkman delivers 2 and tells you not to worry about it. Then you decide to order 2 every week and you still keep getting 2. There is no change to the delivery you are used to getting. Hopefully this makes sense.
Added to this, OPEC+ and IEA have had dramatically different demand outlooks for the last 6 months. However now, IEA is the one adjusting closer to the OPEC+ projections.

Also, add in there that this record US oil production is now looking like it may contract into 2025. This is the expected tight run lifespan that you should expect from shale fracking wells. In short, shale fracking wells have a high production level at the start of their life, then trail off dramatically after their first year. Kind like a sugar high!
Okay, let's look at trade. Here is the seasonal pattern of WTI each year using a 30 year lookback period. Clearly you can see we are at a point where we need to sell down- pick up more buyers, reaccelerate through the summer, then sell off into winter. Ill be following this over the coming months - so stay tuned for some great trades.

To get more precise trading data, we look at the 30 year seasonal patterns in the August contract. Below, you can see that we have about 2 more days of selling, may a week f sideways, then a reacceleration of buying to come in. So if we marry these two charts, we should see selling abate at the end of this week, providing some nice long trades next week to put in new highs on the year.

So lets look at this week. The daily bars annd Quarterly Vwap currently tells me that while we have bid up over the last 6 days, we remain rotational and balanced on the Q picture. i.e can rotate up and down within Q-PVA.

Utilising the monthly vwap, you can see that the market did reclaim the auction of the prior months value area, however as I write this, price is not yet able to reclaim the M-PVAH $79.49.
THE TRADE
I think it possible for the market to rally from M-PVAL $77.68 to the MPVAH $79.49 AND AROUND q-pvah $79.61 and then sell down, however looking at the lookback data, it may just flop down through the MPVAL $77.68 and head straight to M-VWAP $79.00. From there, it should actually break down and go lower. Do expect buying at M-VWAP to bounce us to as high again as Y-VWAP $78.29s or MPVAL which would then be resistance.

Thats it from me. Im off today cause its a pretty quiet data day and off on Wednesday. I hope to follow up on the Edge series of posts this week. So stay tuned. As always, if you want to learn more or get in touch, just mail me tim@duggancapital.com.
If you are interested to learn more and develop your edge, please the Duggan Capital website.
3 Month Alpha VWAP course. 3 months at £275 or £825 one of.
12 Month Alpha Edge Course. 5 days free trial £250per month or £3000 one off.
4 Week Alpha Pro Course. 4 Weeks intensive learning.
All courses include full access to the DC LIVE video trading Discord which is normally $200 US per month.