
The risks are outside
Earnings and Data to drive the week

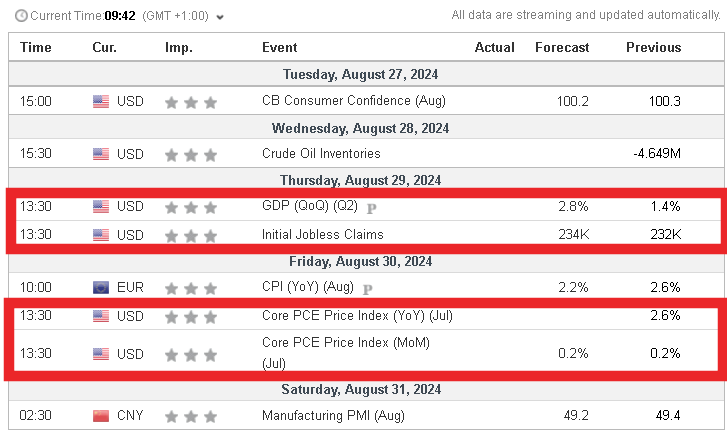
This week we will be focused on
Wednesday - NVDA 0.00%↑ earnings are out post market Wednesday
Thursdays US GDP
Fridays US PCE and CORE PCE.
With the concentration we have seen over the last 18 to 24 months in stocks, the rally for the large part has been underpinned by Nvidia. Many reference the dot.com bubble when referencing the hype and concentration in tech driven almost entirely by the AI goldrush. And Nvidia are the ones selling the shovels. To be brief, if Nvidia has bad earnings (which they should not), it can have a broad and sharp effect on Equity indices i.e ES, Nasdaq. Dow and RTY will be less affected, however they will get dragged down with a correlation effect should ES push below 1% drop on the session.
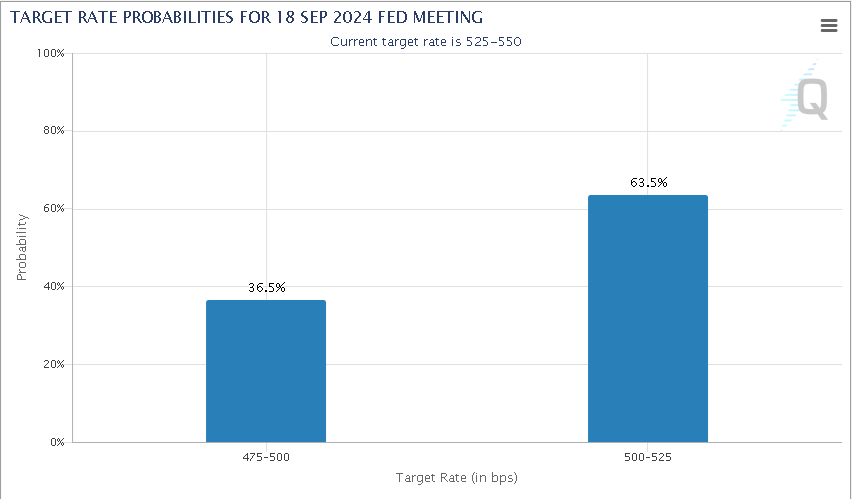
Looking to Thursday, GDP is a really hot potato. With the BLS marking down 818,000 jobs losses last week, we cannot ignore that this will have a read across to GDP in a negative way. Before the BLS data revision, I would have said GDP is set to remain strong and buoyant for stocks. However, now. We could see an inline or miss figure. This would be bullish for stocks in that it will be yet another data point that corners the FOMC into the September cut. 36.5% is the number by how much the market is pricing a 50bps cut for september. With only 63.5% priced for 25bps. This tells me that 36.5% of the market are smoking crack….again. So net net. It will be a 25bps cut.
The reason I am talking about all of the above, is that the markets are entirely protected and backstopped by The Feds looking cut and its ability to cut not only 0.25% but 0.50%.
Do we get hot PCE? The Fed can react, so we go up.
Do we get negative GDP? The Fed will cut, we go up
Do we get rising initial jobless? Fed to cut, we go up.
What can cause a real capitulation however, is an exogenous shock, and that is why the Yen stays firmly on the radar now. So……TO THE CHARTS!
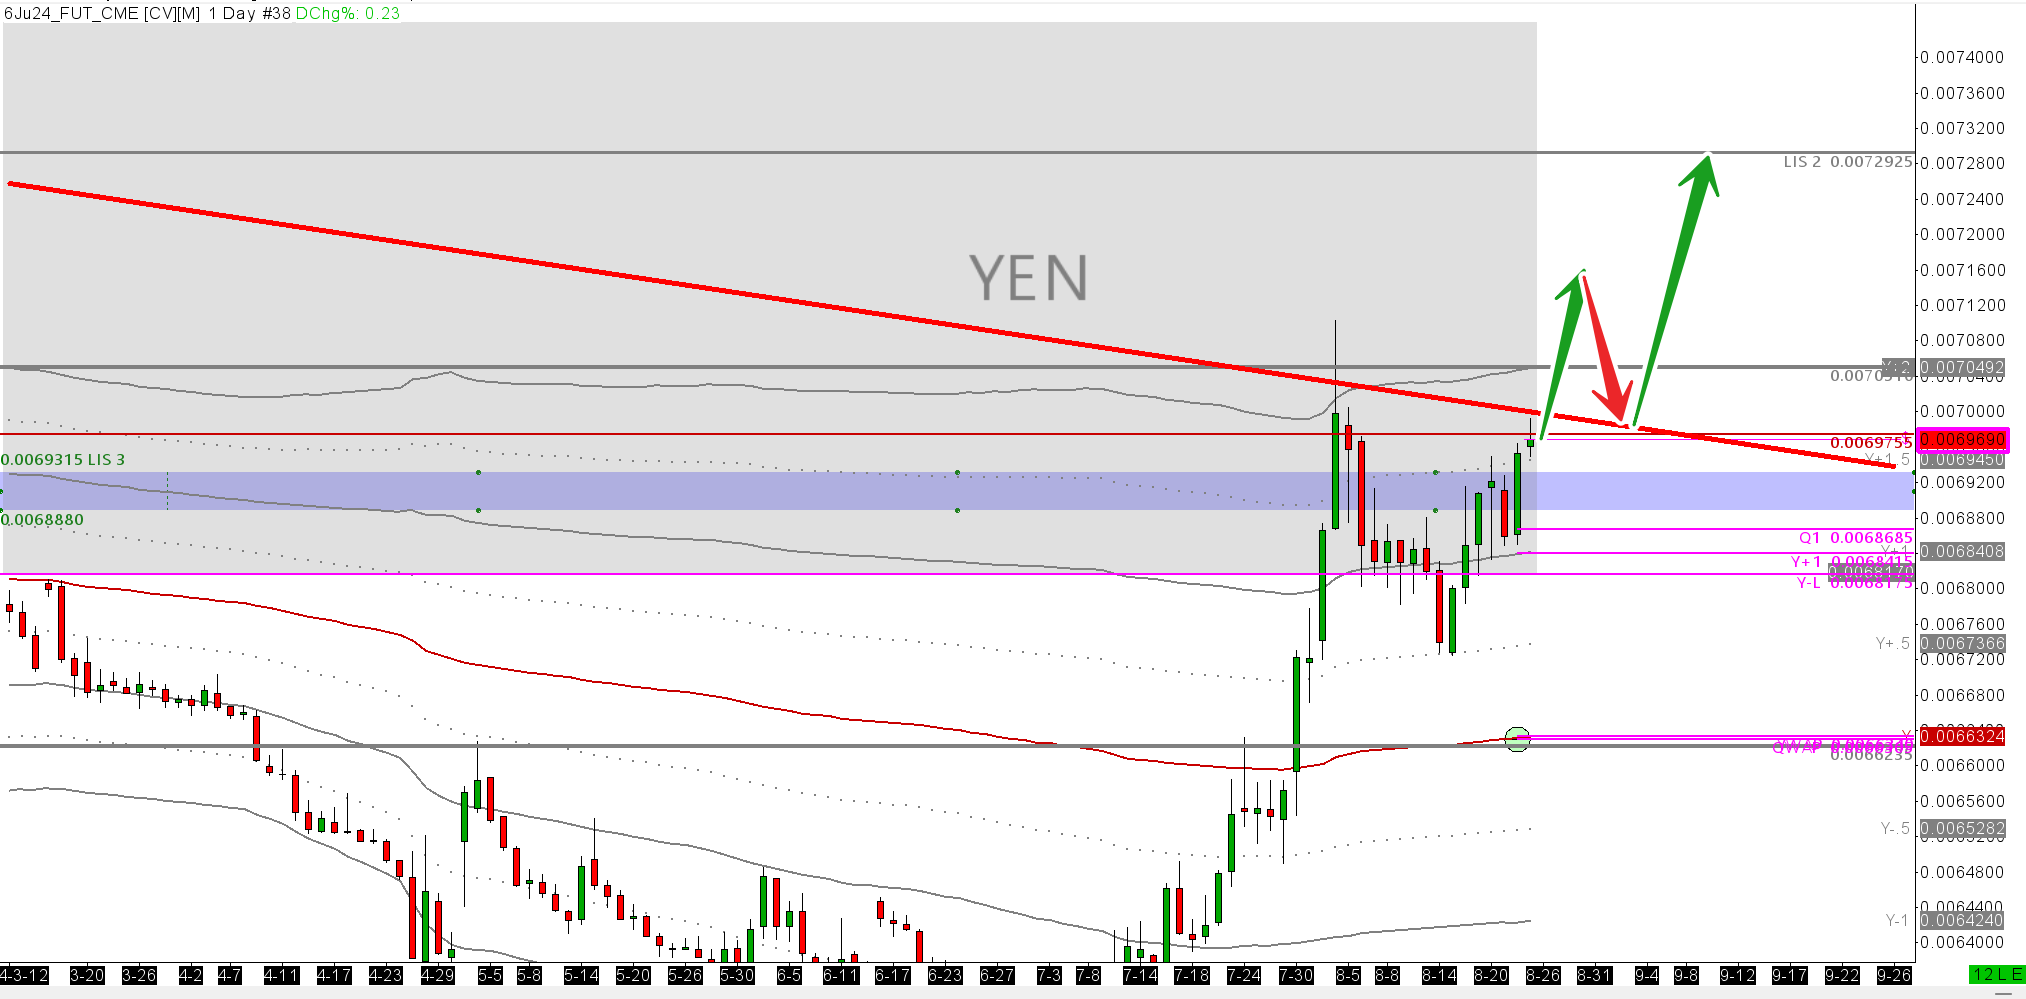
Yen Index 6JU24.
The strength of Yen to USD is the sword that dangles over the market head. Should we see a resurgence of strength, we will see a further unwinding of global markets. It has to be said, it will not be a long and lasting capitulation, but as many have said, more a question of liquidity. The only unknown is how deep and for how long. How deep a correction could be is anyone's guess. How long could we stay depressed? Not very long. The dips would be worth rebuying- similar to what we say at the start of Aug.
With that, I see the Yen does not want to come back to average pricing as of yet. Yearly and Quarterly VWAPs have now converged. This tells me that there is tremendous value for Yen buyers back at these levels below.
The bearish yen case: We can see we have hit a major down-trend starting from the highs of Jan 2023. We have only tested this trend back in March and again recently. It would make sense for us to sell down from these levels - back to Y-VWAP $0.00663. A return to value.
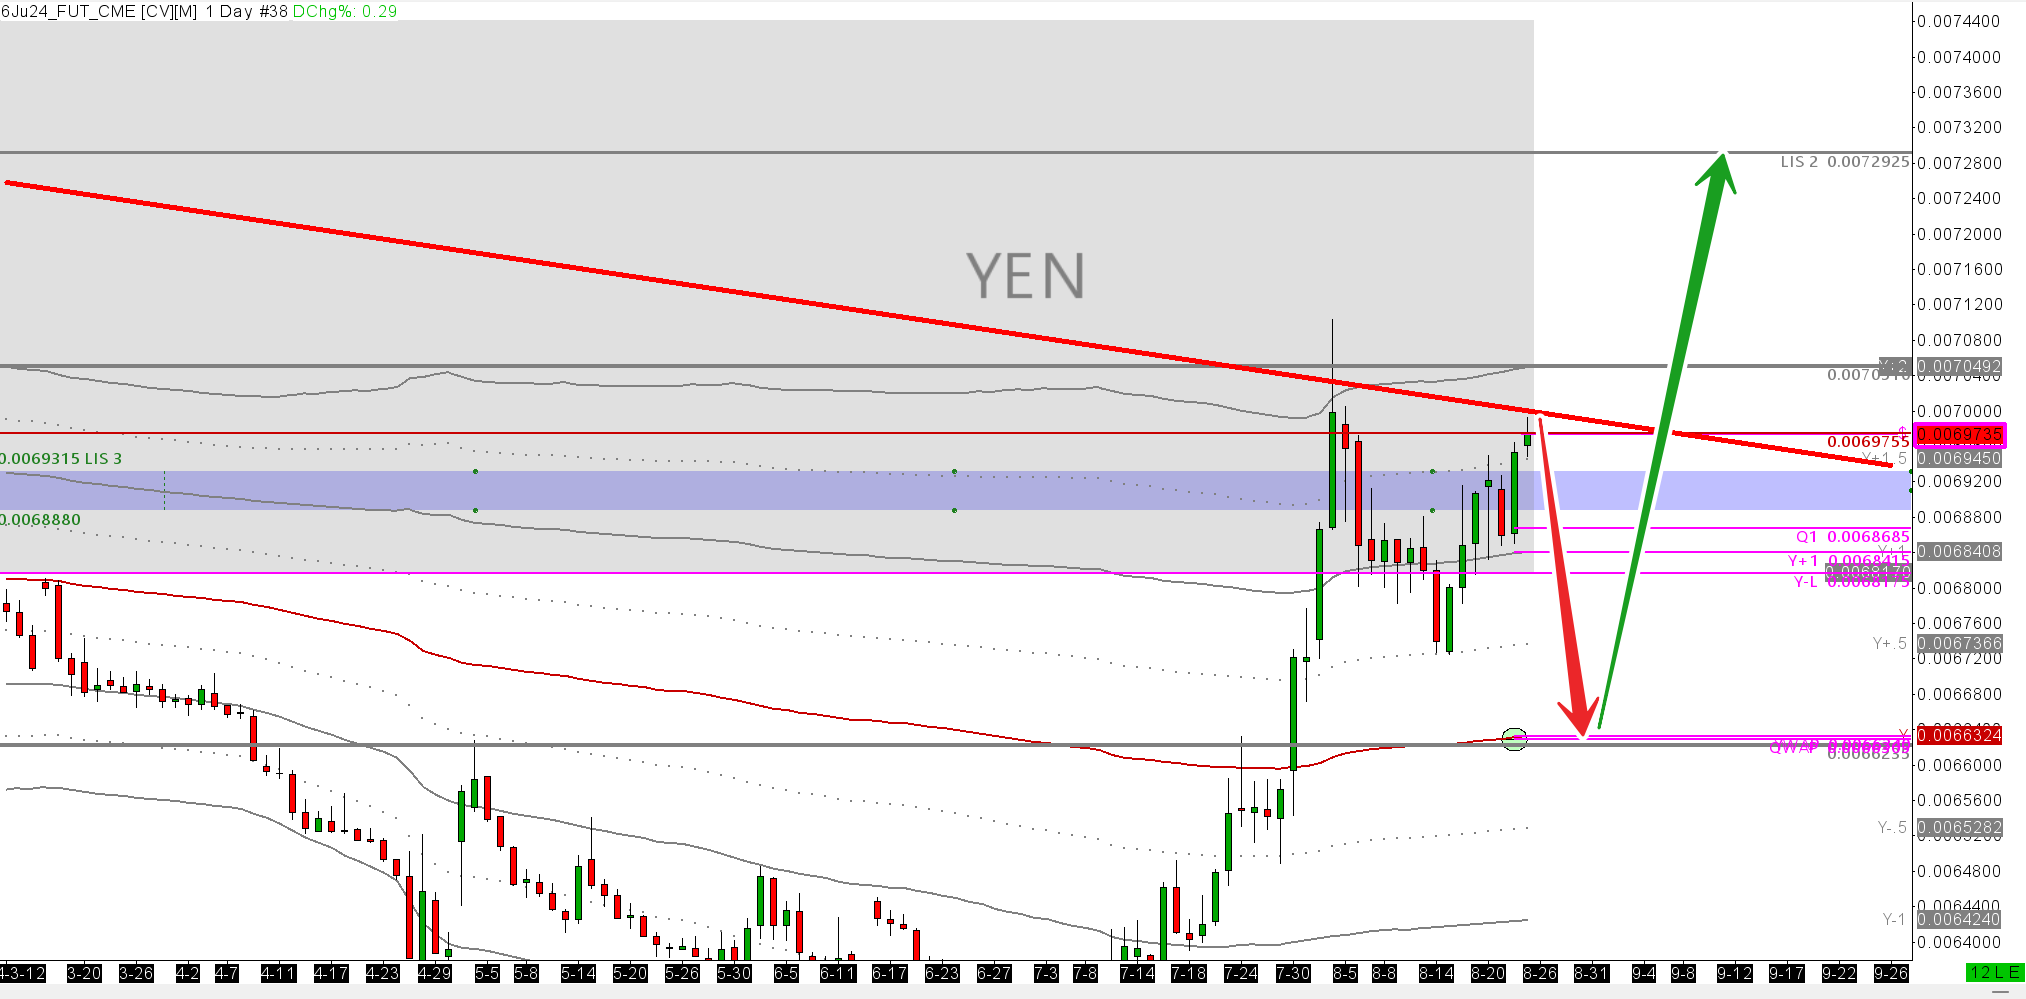
The bullish case: We have held onto the Y+1 for 4 of the last 5 trading sessions. This to me says imbalance up is holding. If this was a 30 min chart, I would buy the y+1 on re-tests, stopping out just below. What can keep us elevated would be a weak DXY, or a hawkish sounding BOJ.
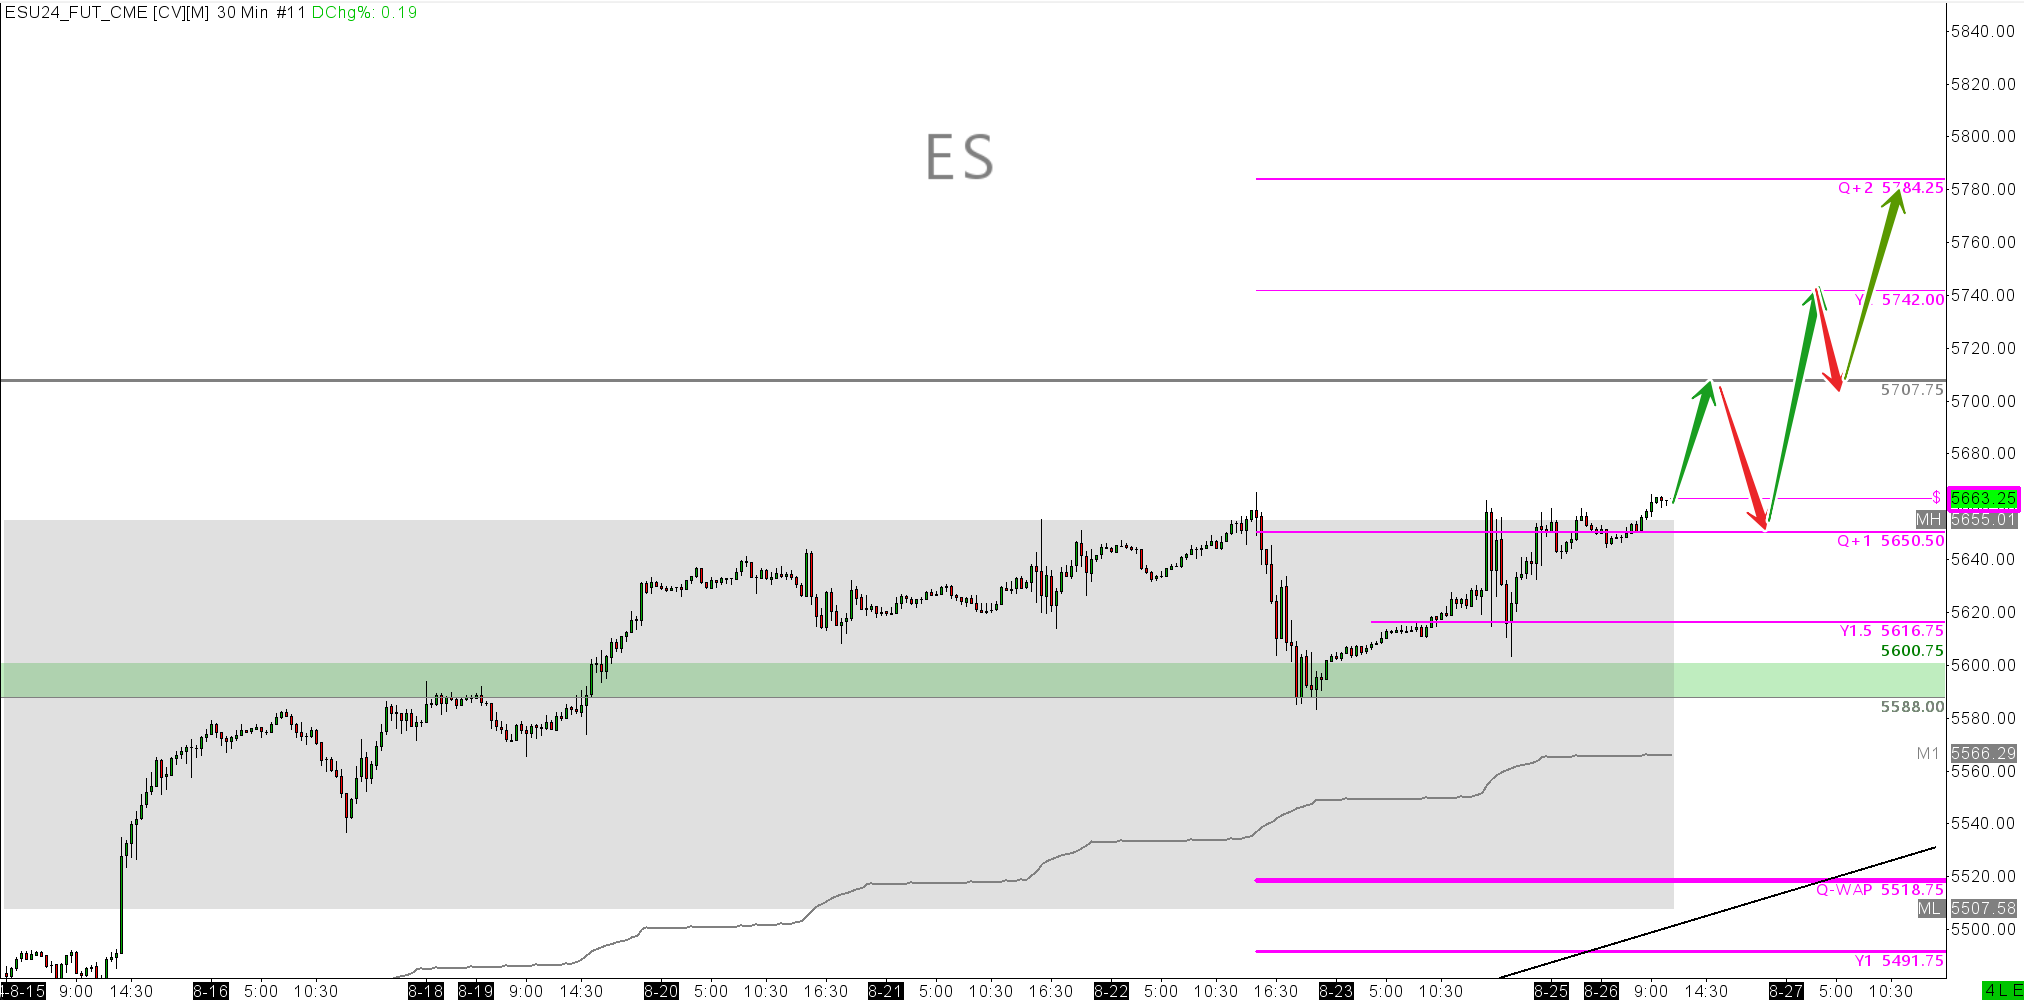
ESU24
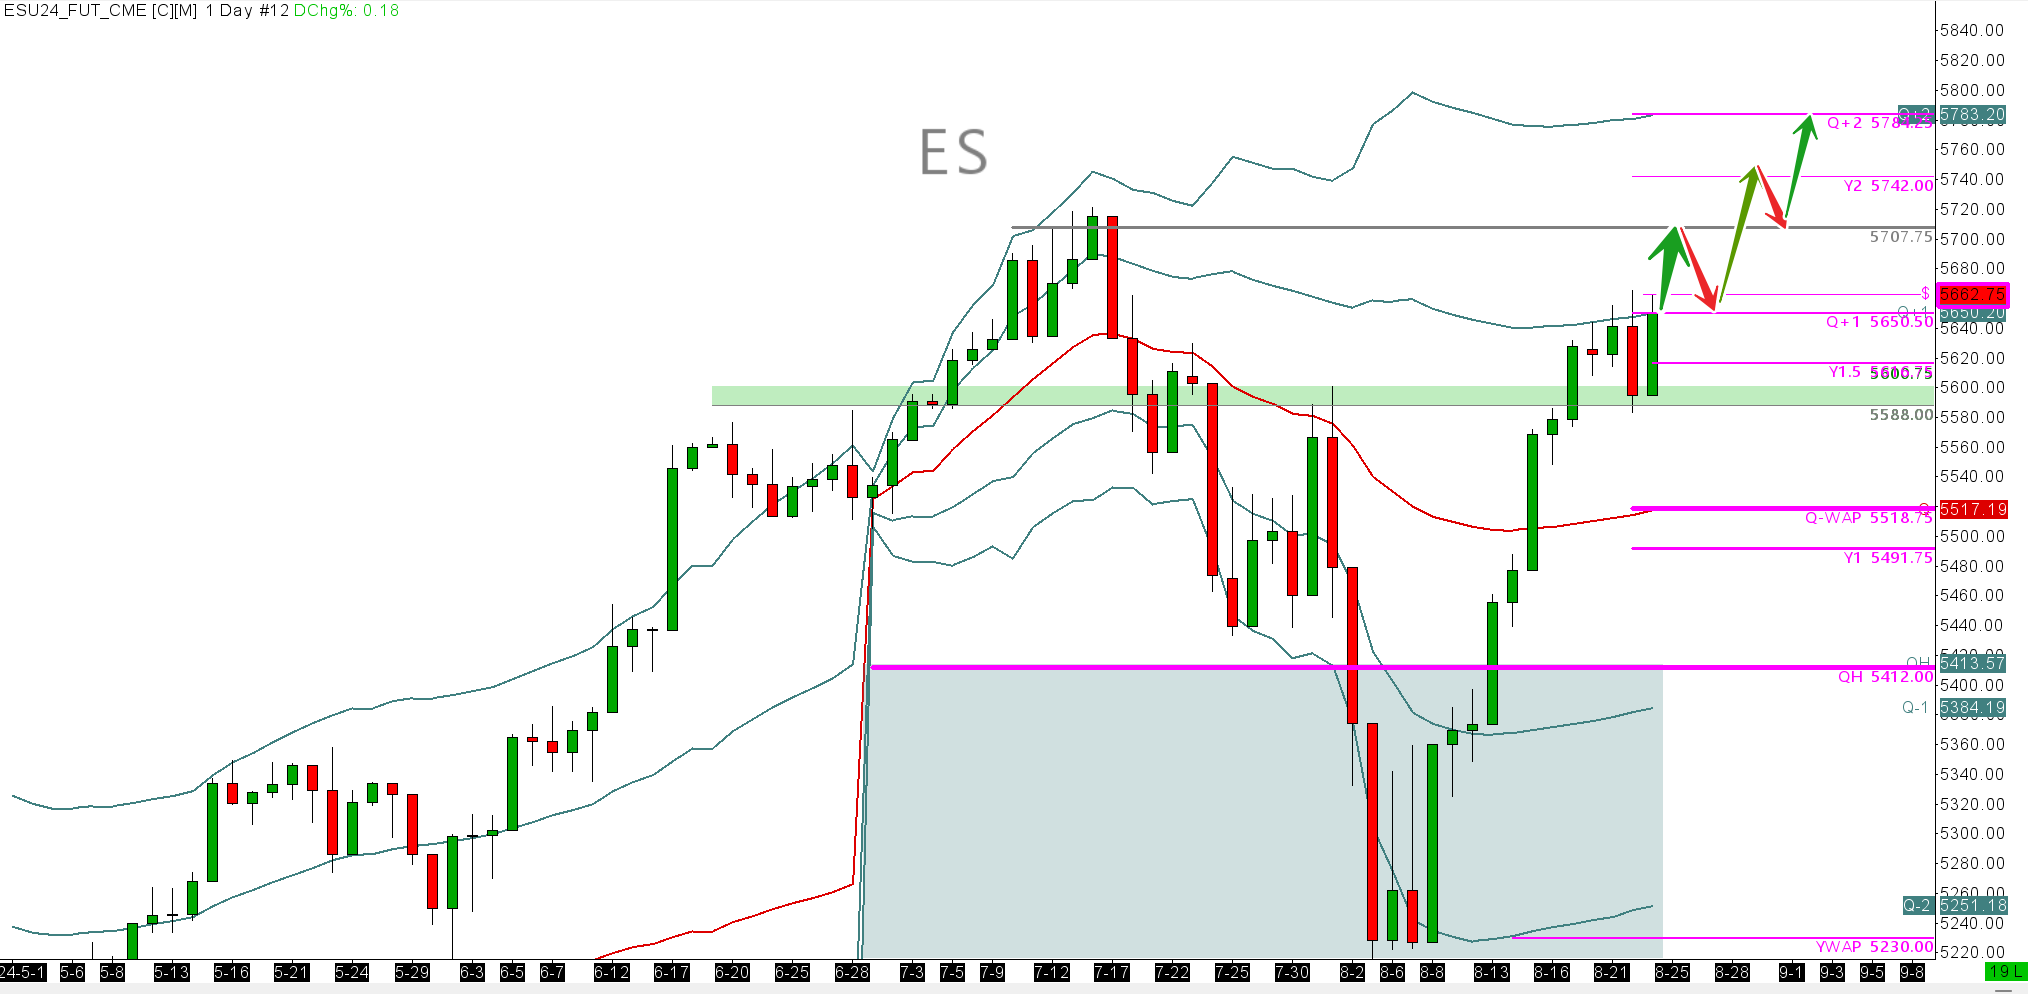
As mentioned above, we only have exogenous shocks that can hurt this market. Until we get to the FOMC 18th September, we can rally rally rally. That puts us on for $5707.75 resistance (high 12th July 2024) this week. GDP, PCE, come what may, any downside is protected for the time being). Factor in good NVIDIA earnings Wednesday, we could have a real party on our hands come the close Thursday. Trade on the long side. I will buy the deep intraday pullbacks at strong areas as per the 30min chart.
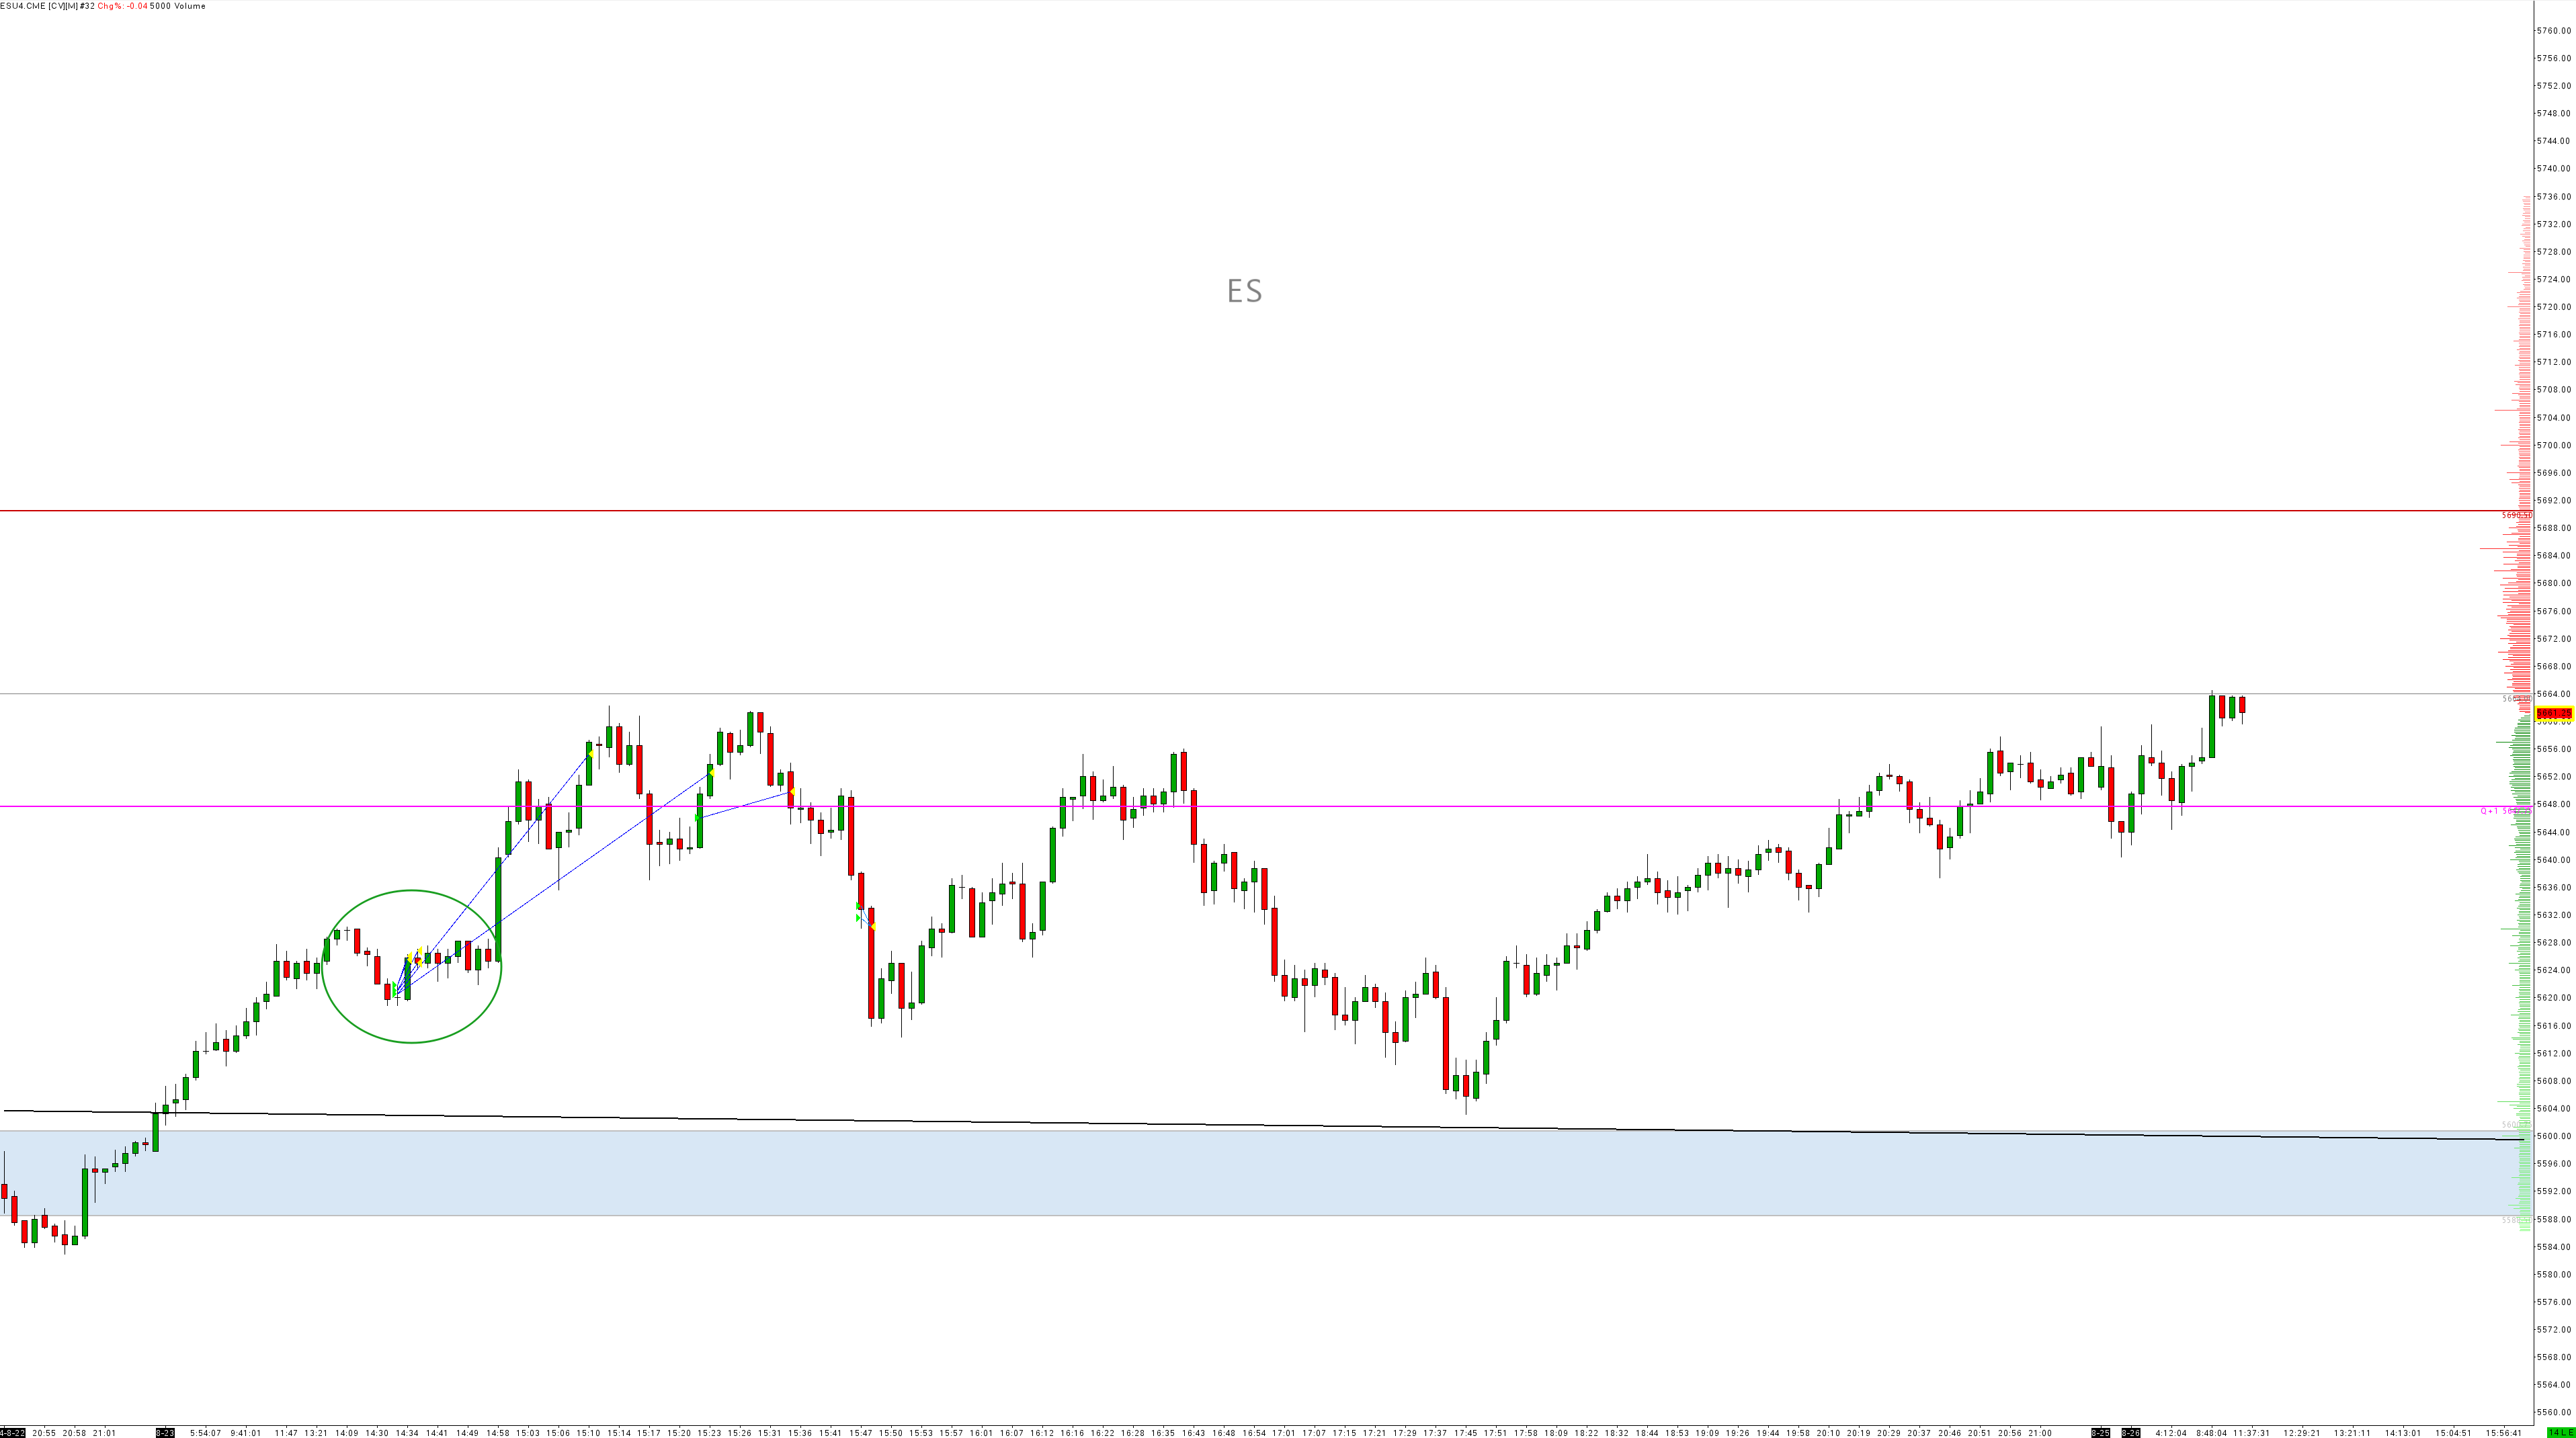
My Friday trade:
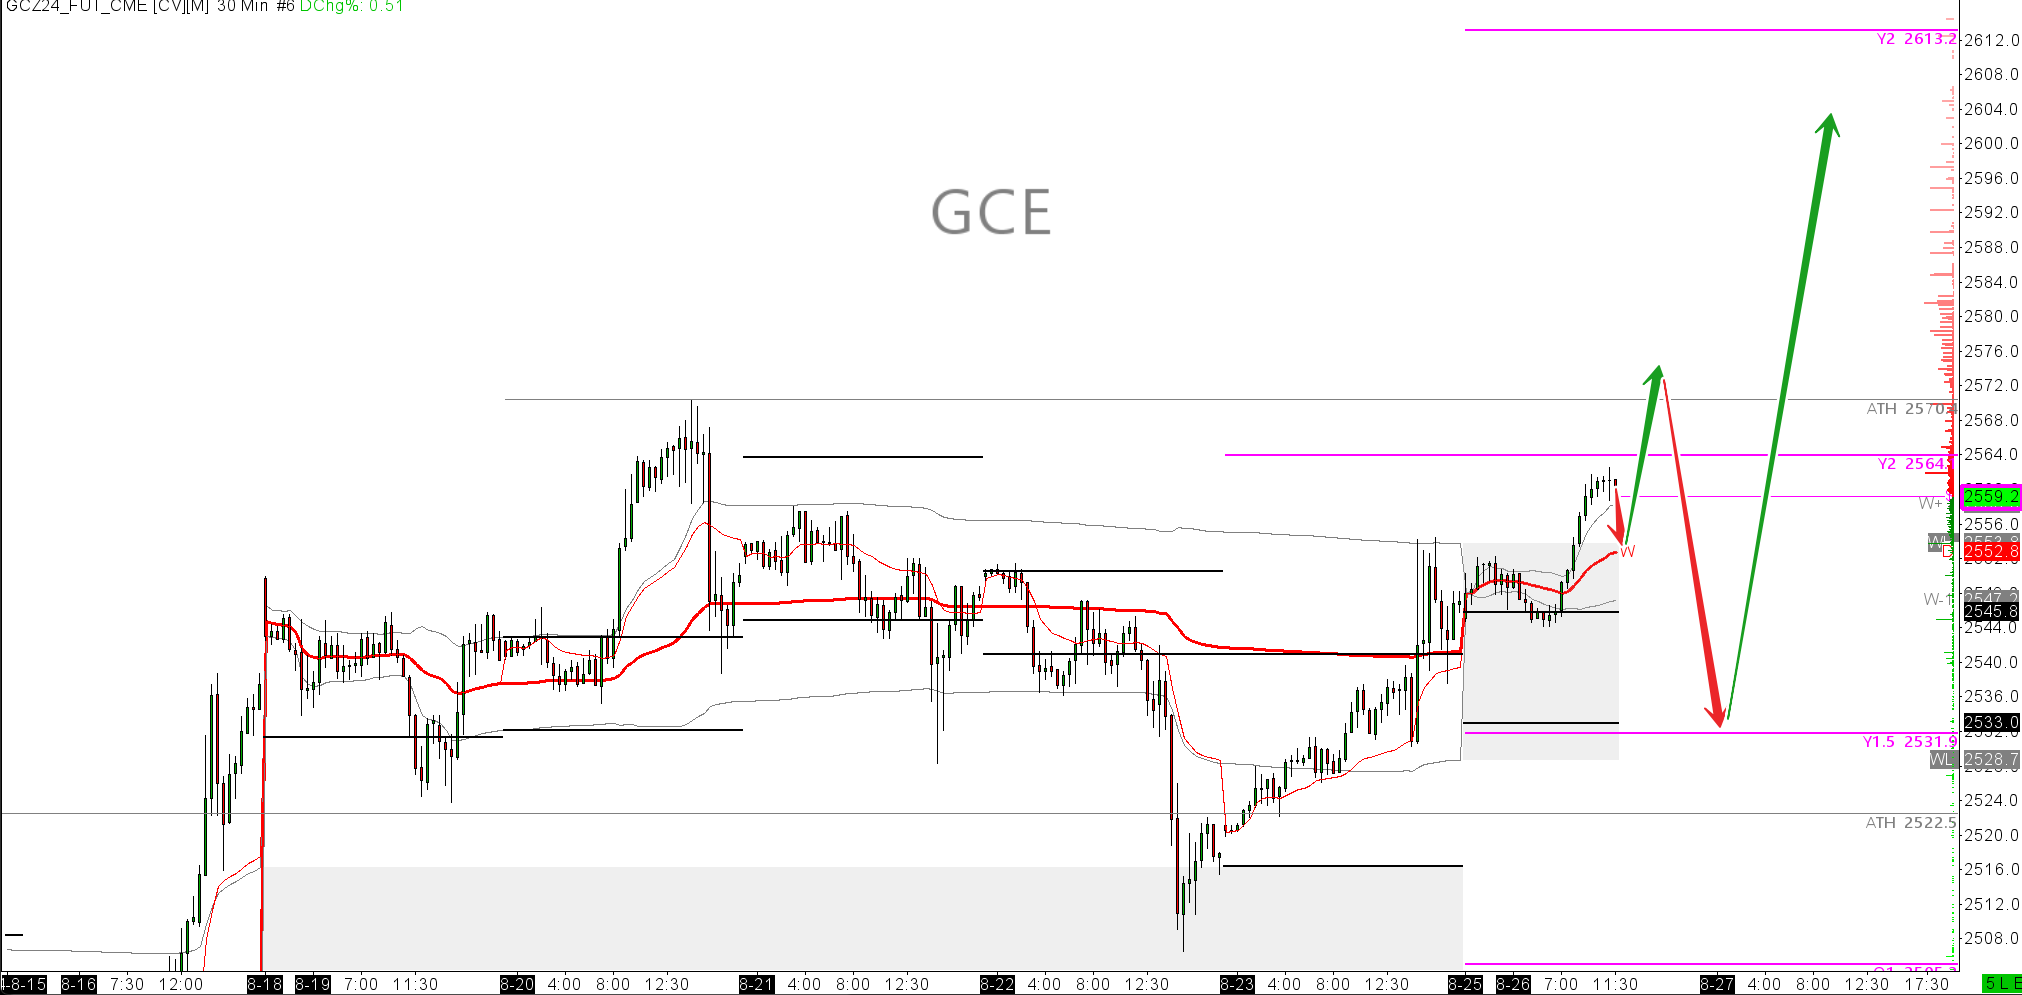
GOLD GCZ24
It took me about 12 -18months to adjust to the new way in which gold trades. The 2015 to 2020 way I would trade was very much as a risk on off trade. Long on risk off ie. Equities down, gold up. And short when it was a risk on move i.e Equities up, gold down. The occasional bout of this correlation breaking was tricky but well telegraphed. In the post covid, post MEGA QE markets, it has educated me in a different way to trade it. Inverse to the real yield, so therefore expect bonds to trade directionally the same as gold. Added to this, Equities up ment gold also up. So net net, it's a shit show, so keep it simple. Don't overdo it. So for me, trade with the context and condition that are present on the given time horizons, nothing more.
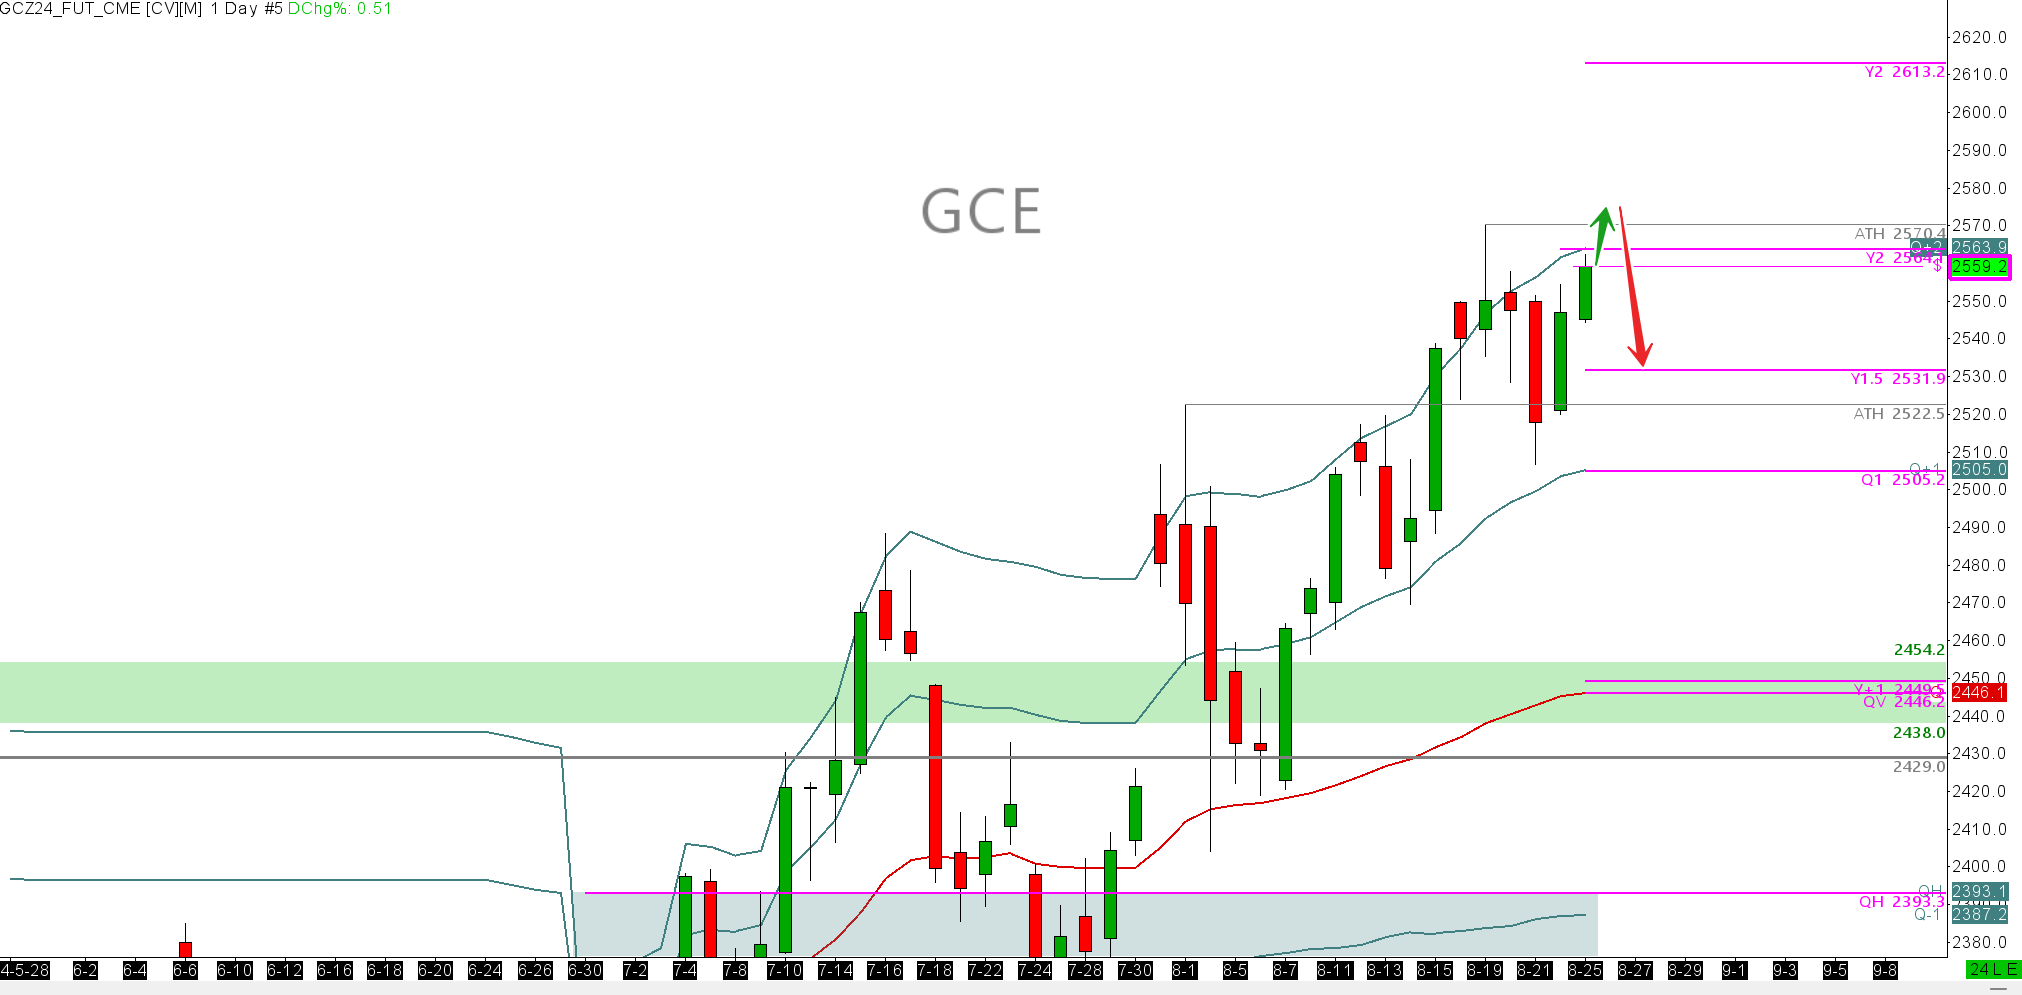
The creedence to this is looking at Gold on its Quarterly timeline here. We contextually hold IB Up, then the market has been a buyer on Q-VWAP and the Q+1 ever since. See chart above.
For trade this week, I see more strength and some nice areas to buy a pullback. I would rather get into gold trades either today-Monday, without the close overhang of GDP, or after we get GDP thursday. See the weekly vwap on the 30min below and how buying pullbacks here is good as long as it's above W-PVAH. Any buying below W-PVAH is compromised for tight risk trades. We would need to trade the Y+1.5 $2531 to see any strength of buying come in. Trade accordingly.
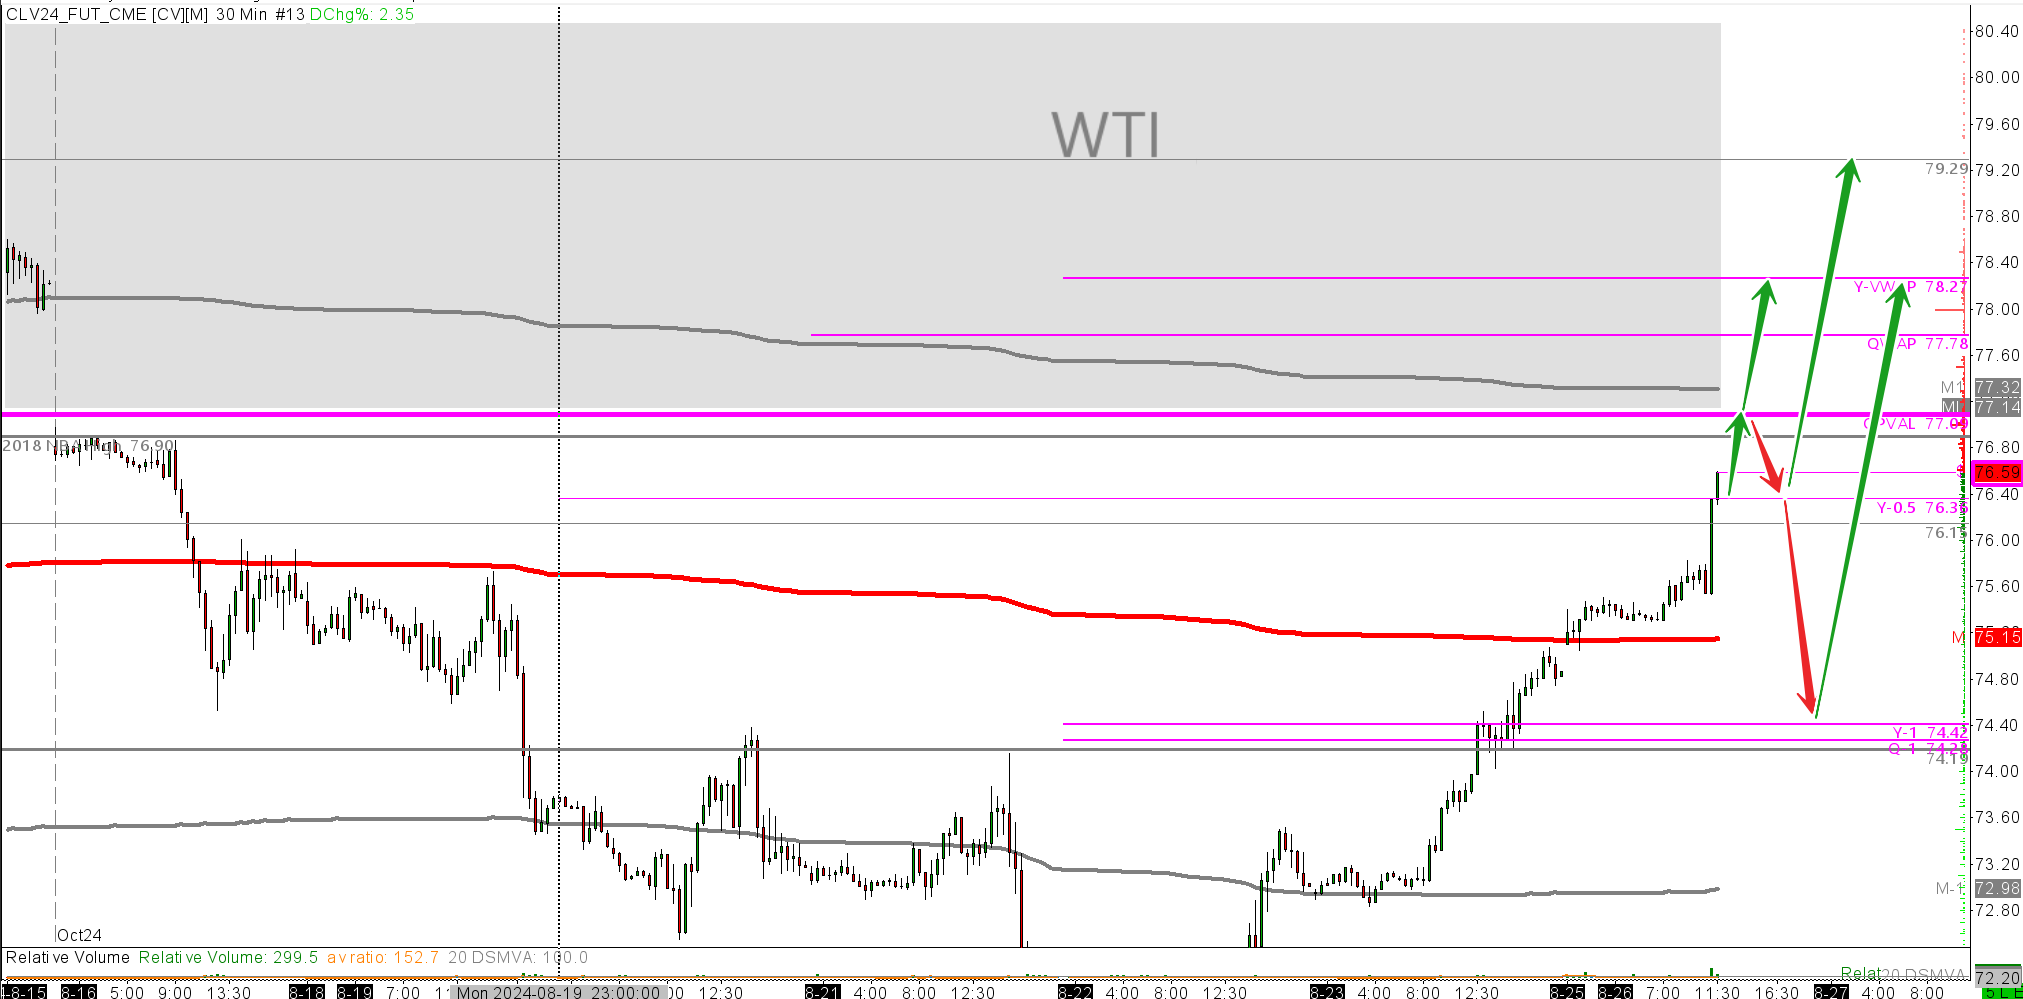
WTI Oil
CLV24
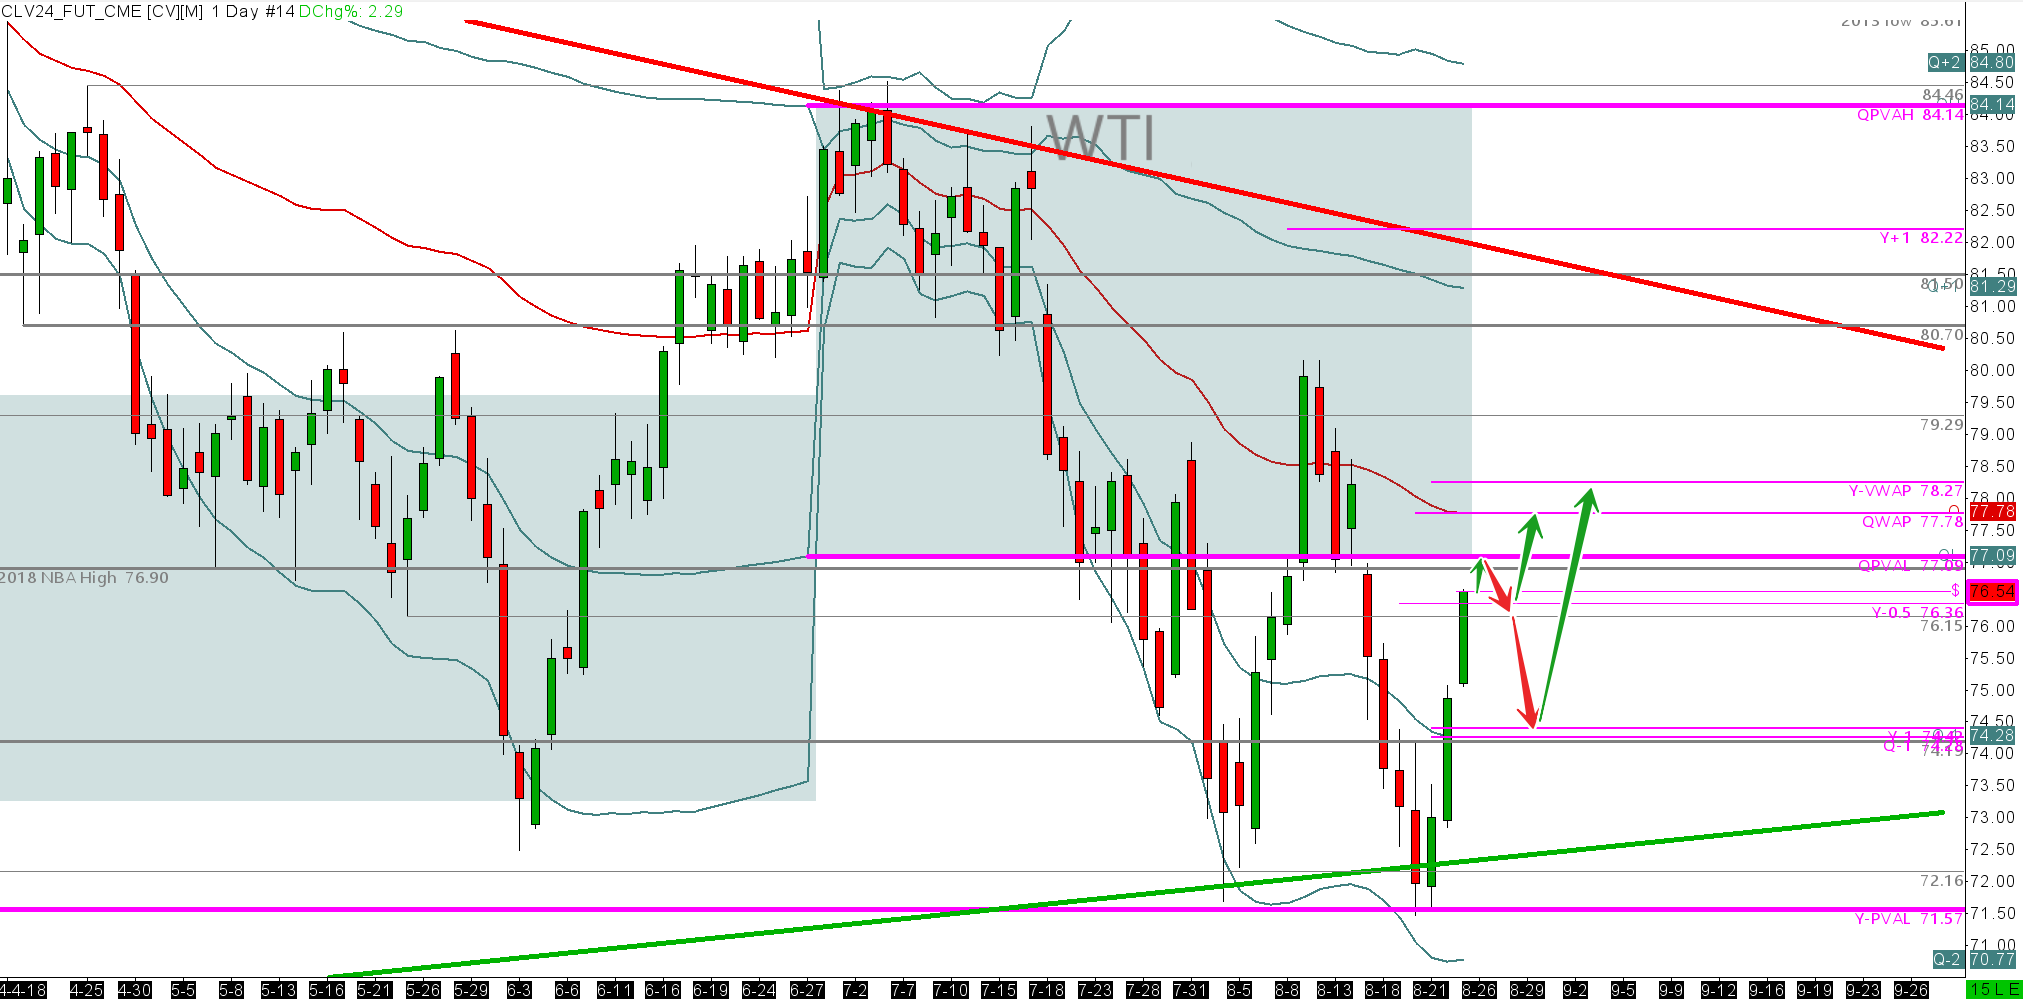
War risks have surged again with Hezbollah firing 350 rockets into Israel over the weekend. The Israeli response was to launch drone attacks in the south of Lebanon. Recent footage of the airports in Israel indicate that people are fleeing the country now as counter attacks are getting through the Iron dome system. The overall picture now seems to be picking up a great deal. Thus, Oil is up currently 2.53% on the electronic session pre the NYMEX session. I really don't see oil giving much of these gains back at all as these risks are clear and present. I don't believe we will see a grand attack from Iran. The Iranian strategy it seems is a wise one. They will not be drawn out by Netenyahu, a desperate man who now needs major escalation in order to hold onto power and escape the pending war criminal charges that await him
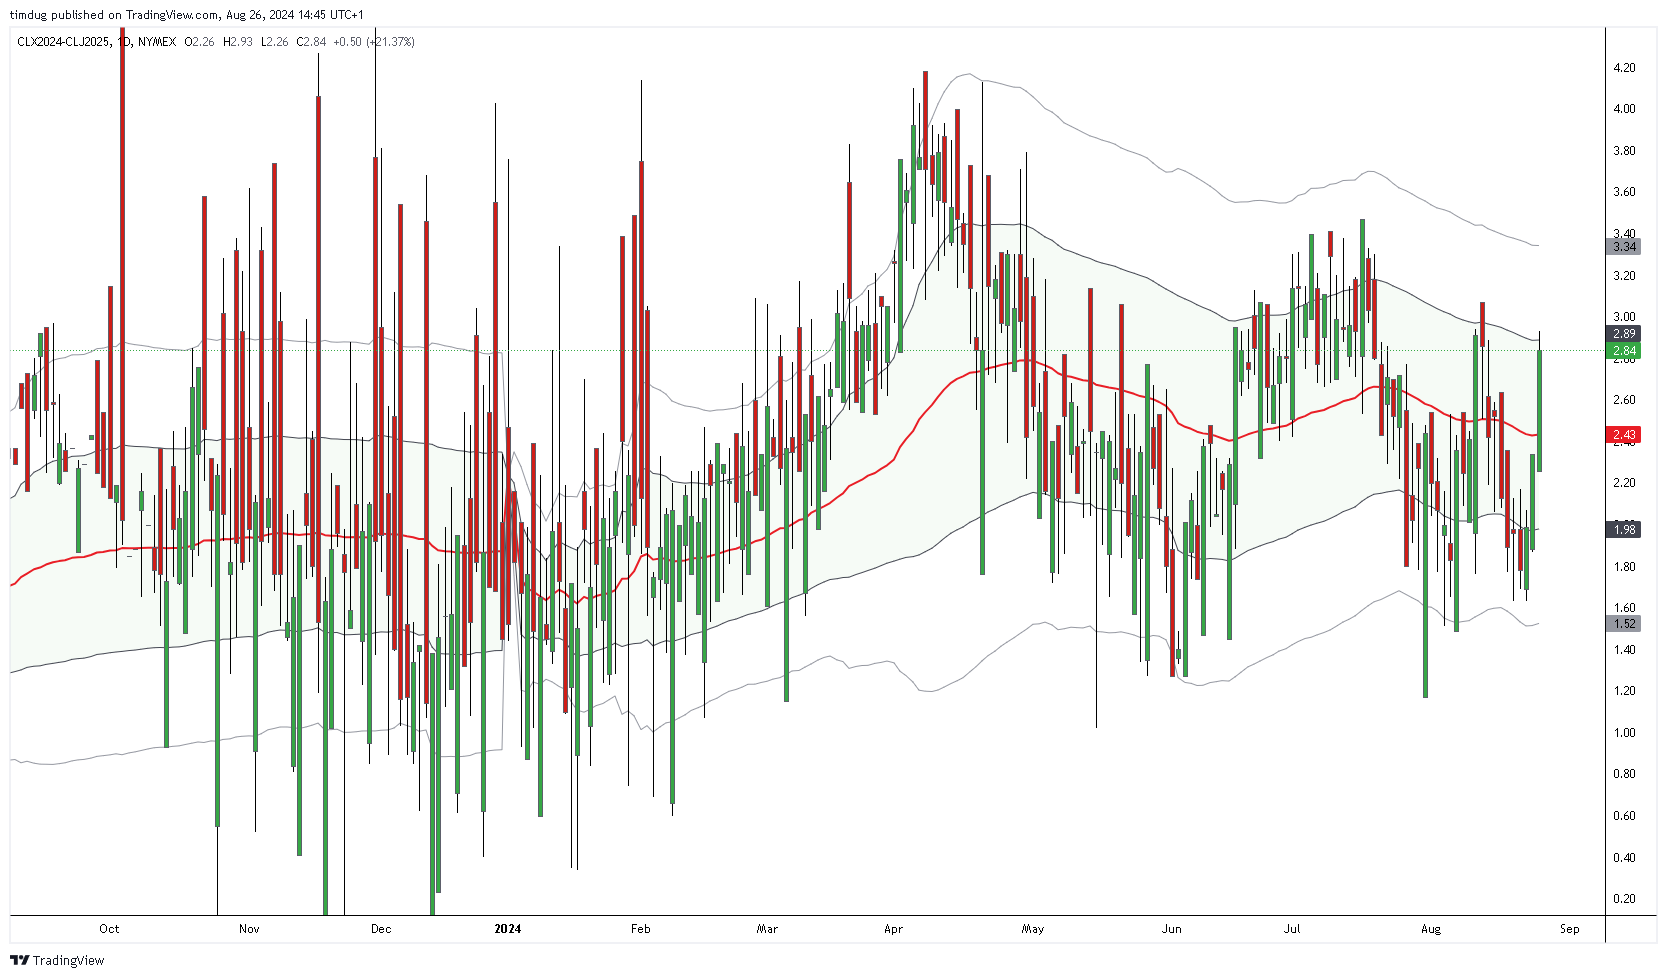
We have entered one of the strongest time spread periods on the oil curve for the year looking at the X/J I.E November24/ April 25 timespread. This is something that we trade on heavily and we expect over the next 4 weeks that this spread will appreciate $2+. Current price $2.85. If you are a spread trader on calendar spreads, please tune into the room with some discounts available.
Okay folks. It has been a good August for us so far and we aim to keep it that way. Keep your sizing consistent, stick to your risk profile every day and don't get caught up looking at small time frame charts. Trade with the bigger moves. I will be updating with more posts during the week. Keep it tight out there and drop a comment or a chat on this report or my way and say hi.
3 Month Alpha VWAP course. 3 months at £275 or £825 one of.
12 Month Alpha Edge Course. 5 days free trial £250per month or £3000 one off.
4 Week Alpha Pro Course. 4 Weeks intensive learning.