Geopolitical disarray
Officials Speak
In this report, Equities to move higher - ES rally, Iranian disarray, Oil hampered by seasonal weakness and spreads
Earnings this week from NVIDIA, TARGET, ZOOM
https://www.tradingview.com/markets/stocks-usa/earnings/
Data Calendar
Monday - FOMCs Bostic, Fed Vice chair Barr, FEDs Waller, FOMCs Mester all speaking
Tuesday - FOMCs Bostic, Treasury Secretary Yellen, ECBs Lagarde, Fed Giv Kroszner, Feds Waller, FOMCs Williams, FOMCs Bostic, Fed Vice Chair Barr all speaking
Wednesday - FOMCs Bostic, Mester and FOMC minutes, ECBs Lagarde all speaking. Existing Home Sales April, Department of Energy weekly data.
Thursday - US Initial Jobless claims, Manufacturing & Services PMIs, New Home Sales, Feds Bostic speaks.
Friday - US Core durable Goods, Fed Waller speaks, Michigan Inflation expectations & Consumer sentiment.
Equities
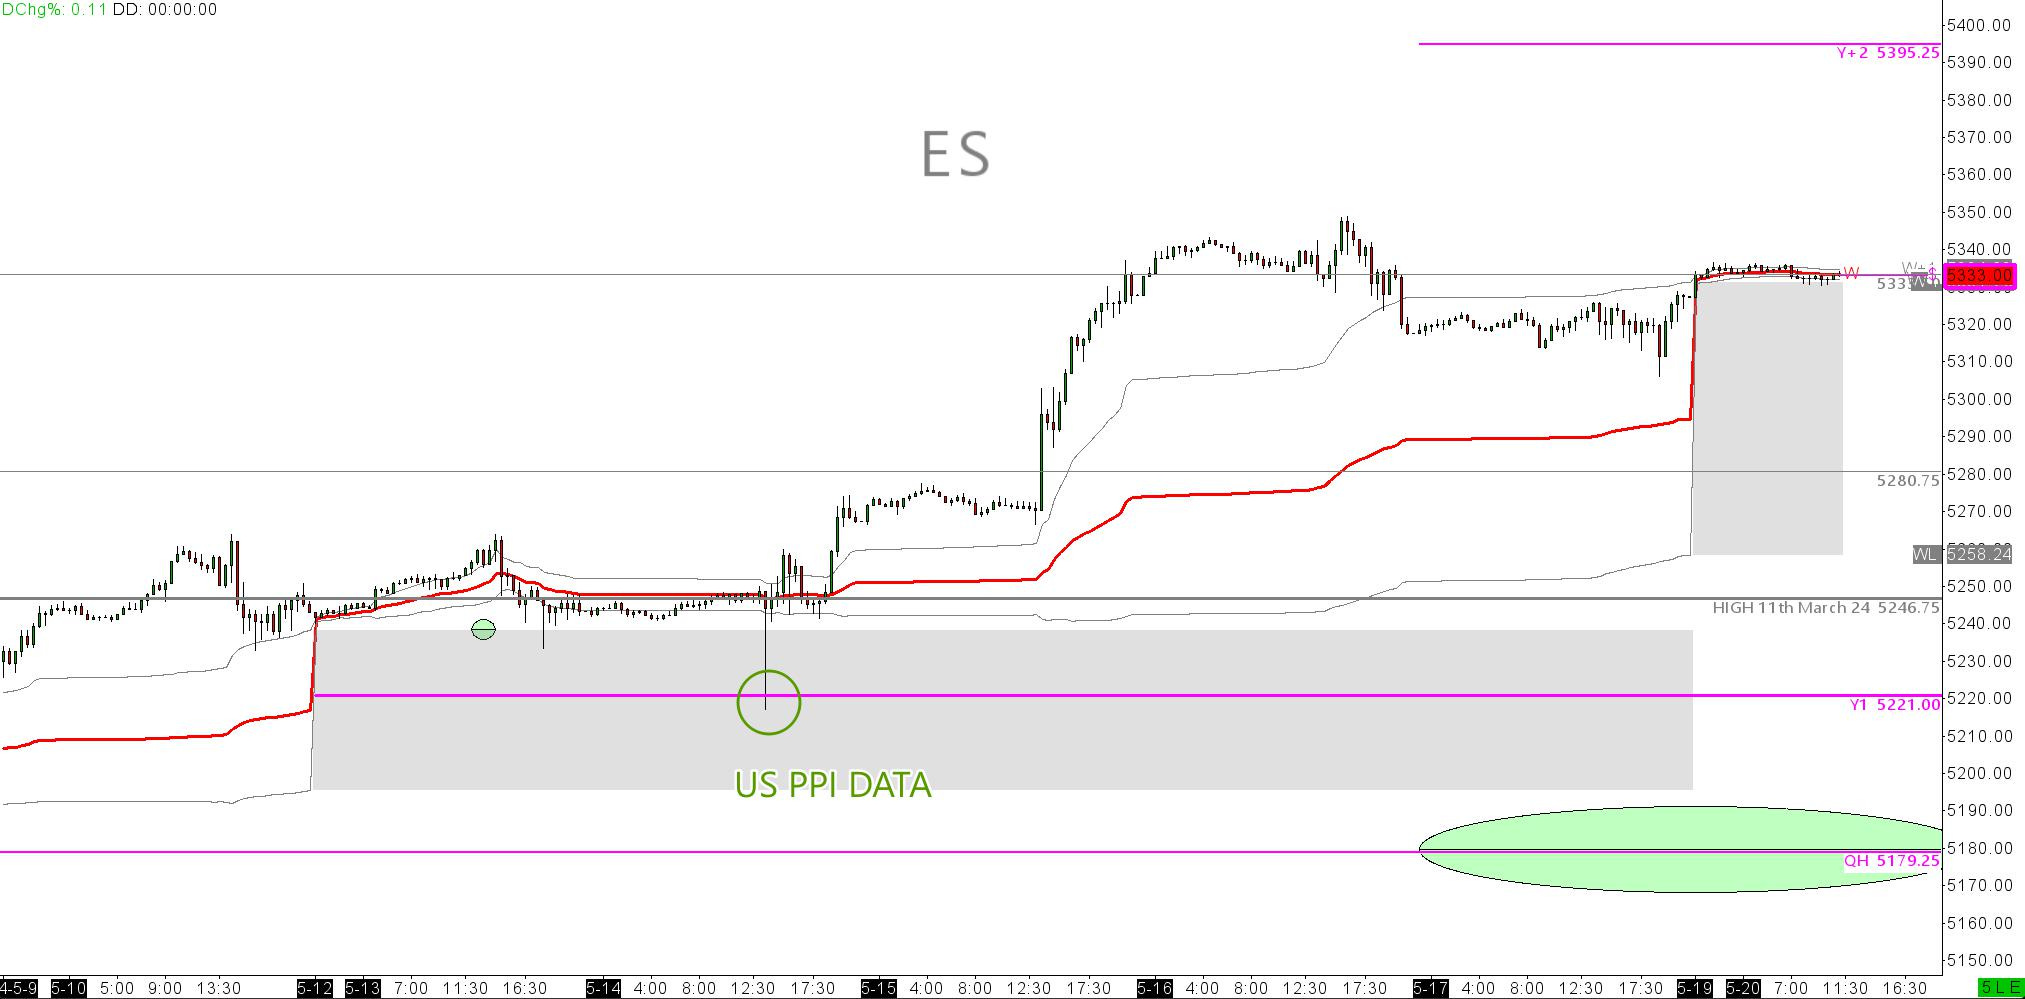
Last week on Tuesday, as discussed, the bulls came in. Bulls will bull! The PPI data came in hot with beats on headline and core. This feeds directly into a Fed cut scenario, and indeed we rallied. The great opportunity here was buying the Yearly +1 deviation on VWAP, which we executed in the Discord room trading live.
A great opportunity for us to have a fast and hard bounce off this dynamic support. The added confidence in this trade comes from how the data will play into a softer Fed stance going forward. We spent the rest of the week on the front foot. This picture will not change unless we have a macro shock or headline that shakes speculative assets.
There is really nothing that can stop these markets now other than a macro headline shock or a wobble from one of the top-tier companies. Keep a lookout for NVIDIA earnings this week.
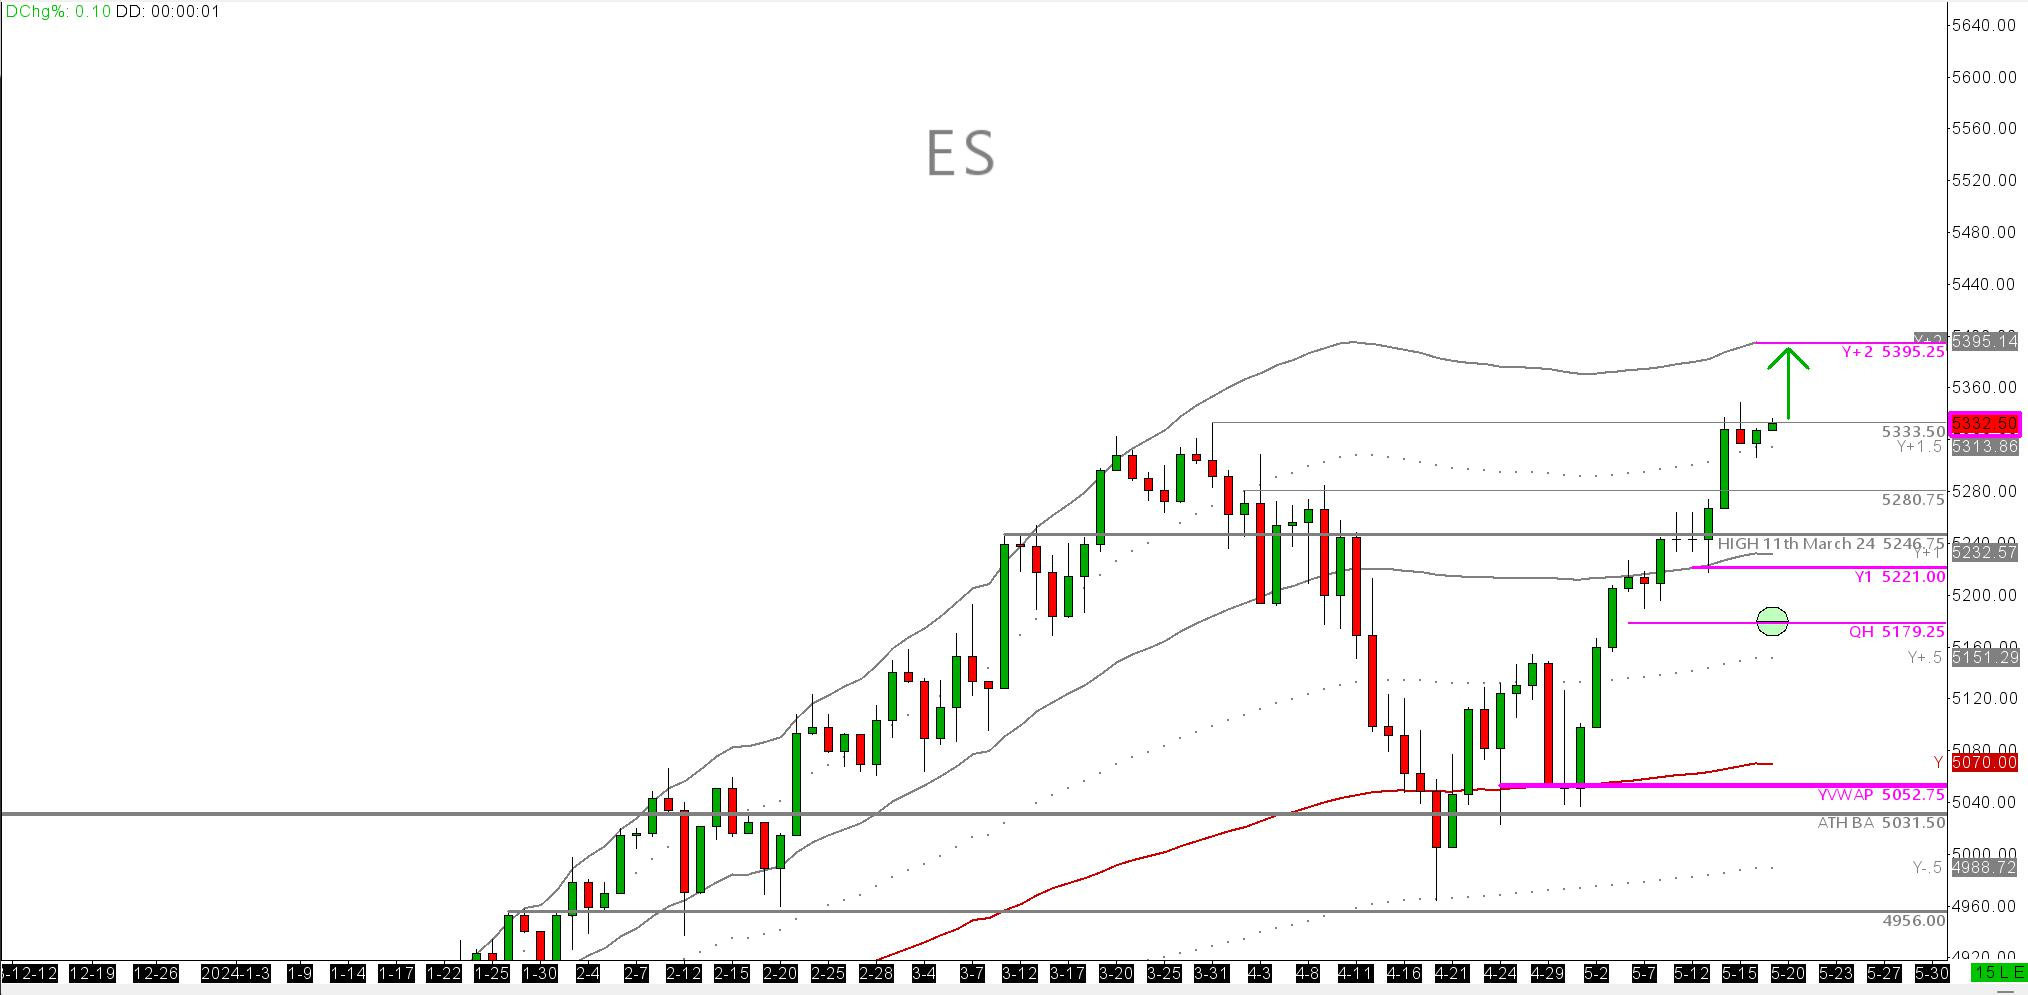
Let's be clear, my base case is higher and higher for US Equities, with yearly +2 deviations as the dynamic target to the upside before we have a calming pullback to reload for more buyers. So what is the other view? Well, NVIDIA could disappoint on earnings (though I doubt it will). This may result in some medium liquidation into the highs we are at. The market prices this rally on NVIDIA at $1400, Yet we are trading just below $1000. There's more room to run. Regarding ES, I see a short-term upside at $5395 and higher. I see support at the quarterly high pullback level of $5179.25. While I think the upper levels and continual new highs will print relatively quickly, it will take the market some time to pull back to the support at $5179.25.
Please reference the weekly VWAP on the 30 min chart above- For us to rally higher,
1-the W-VWAP must hold
We must remain trading the current W-PRIOR VALUE AREA HIGH as support $5333.50.If this breaks,. I will be looking for shorts against this level and W-VWAP. The thinking then is that the market is accepting back into last week's auction area and we must move back to lower supports to load up the bull boat!
The context of the week is that we have a raft of FED, FOMC, and Treasury member speakers. Watch out for any impact they may have. Pay close attention to comments from Bostic and Yellen.
Energy
CLN24 -
Please note that we have moved on volume to N-July 24 as the front month. We are no longer trading M-June expiry.
Oil has really been stuck in the boggy ground, marked by an overly bought Middle Eastern conflict that is now simmering. The latest development—the death of the Iranian President—will not provide any further clarity on the macro picture this week. It is most probable that the elections to come in Iran are a tailwind for US and Israeli aspirations in the region.
If you follow John Kemp, he has kept us updated on hedge fund positioning in energy over the last four weeks, where the war risk premium has continued to evaporate.
Hedge funds and other money managers sold the equivalent of 143 million barrels in the six most important petroleum-related derivatives contracts over the seven days ending on May 7.
Fund managers have sold petroleum derivatives in each of the last four weeks, reducing their combined position by a total of 265 million barrels since April 9. The combined position had been reduced to 420 million barrels (21st percentile for all weeks since 2013) from 685 million (66th percentile) four weeks earlier. - John Kemp
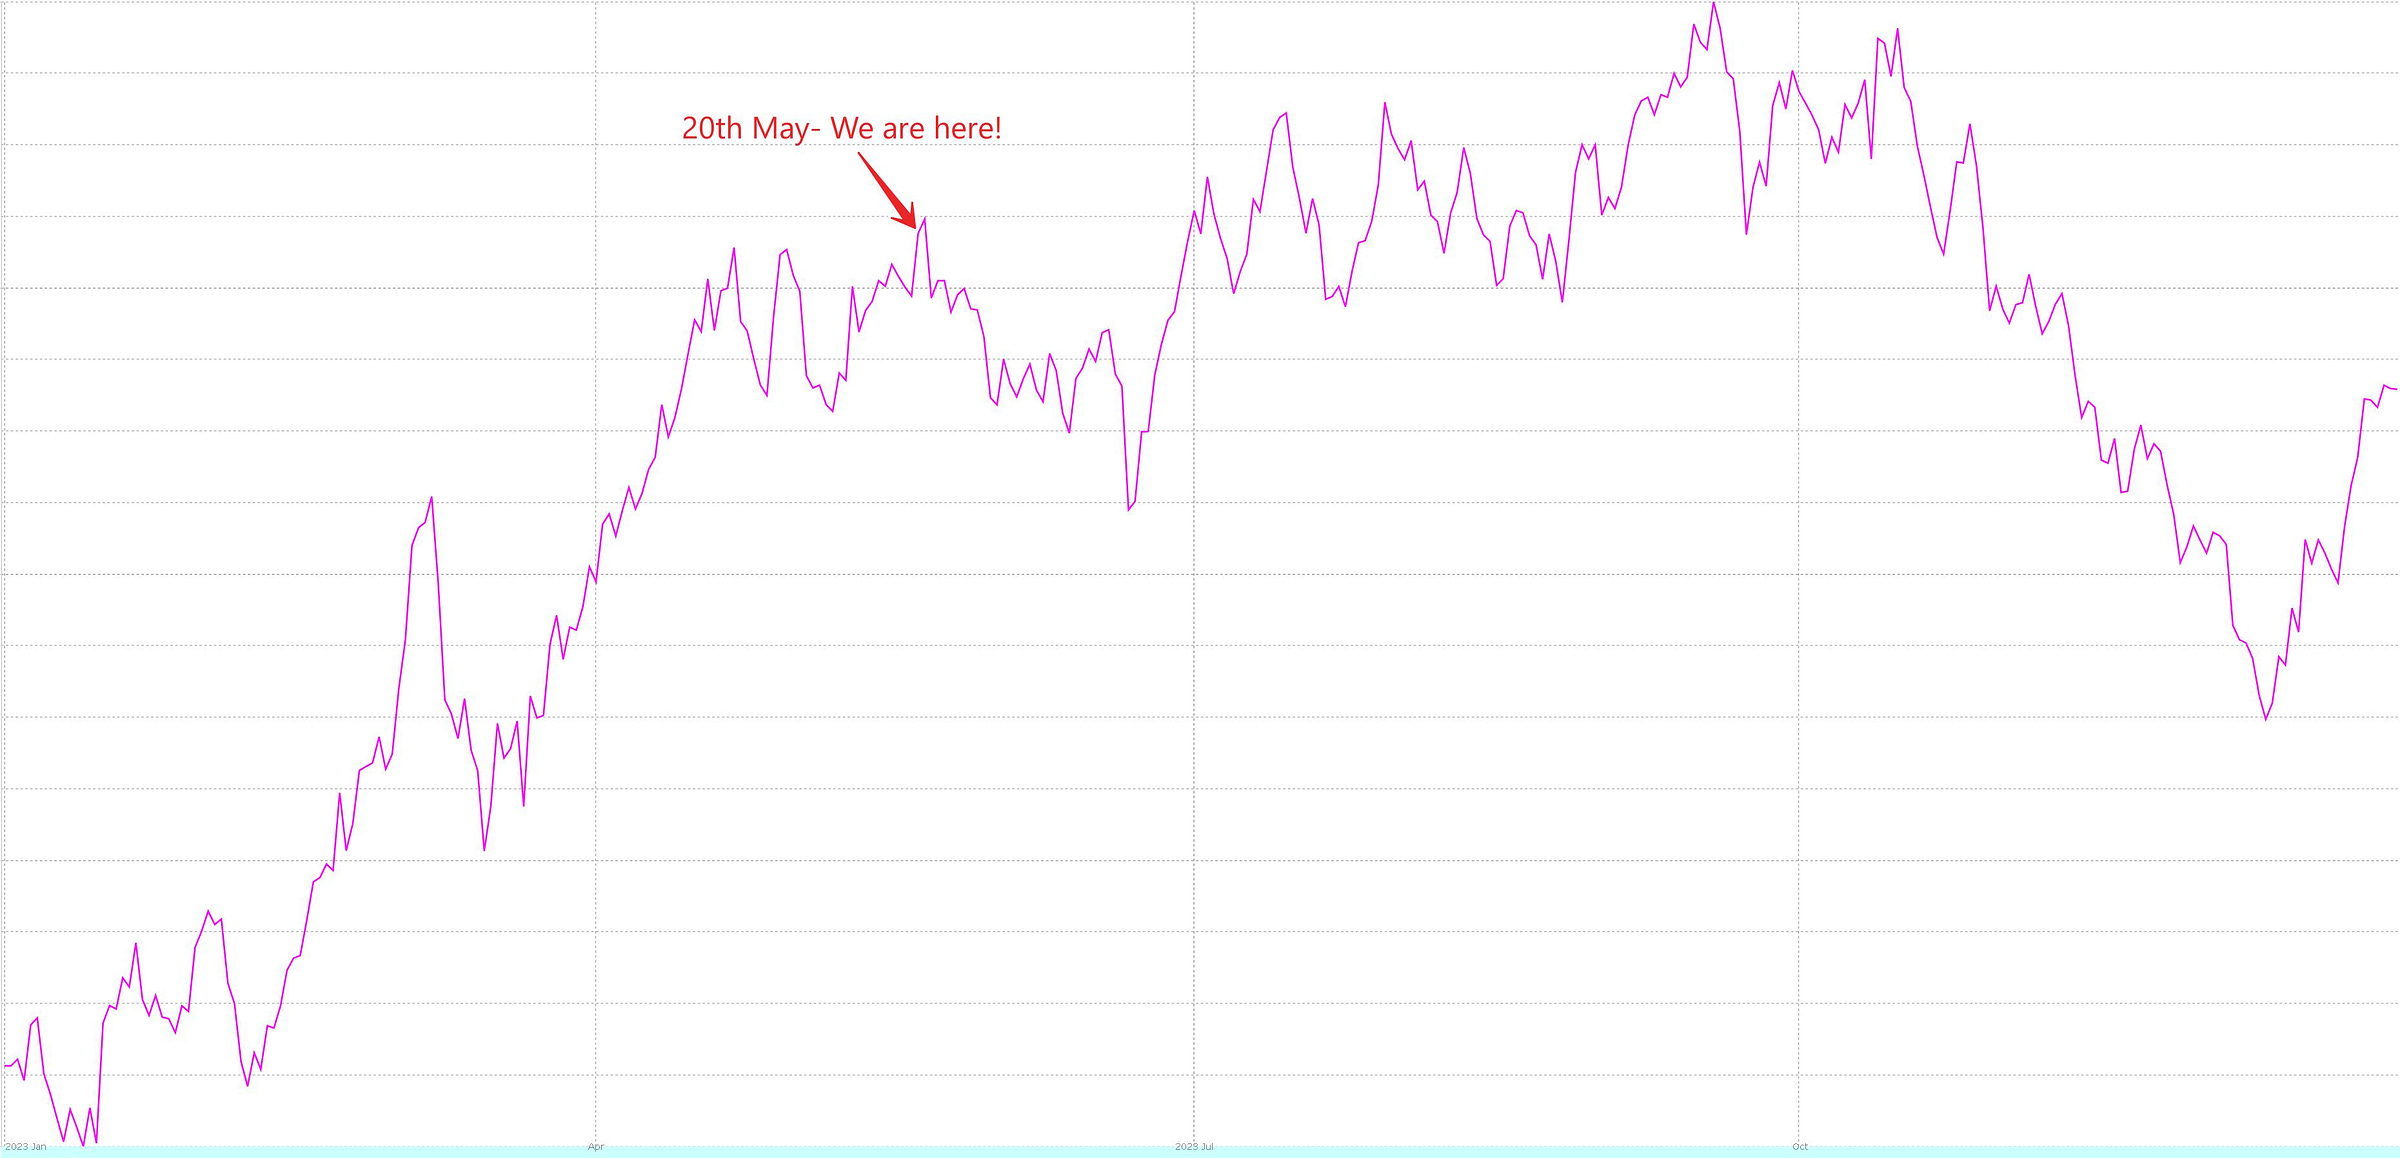
This weakness is to be expected as we look at 30 years' worth of data on how WTI moves across the average year.
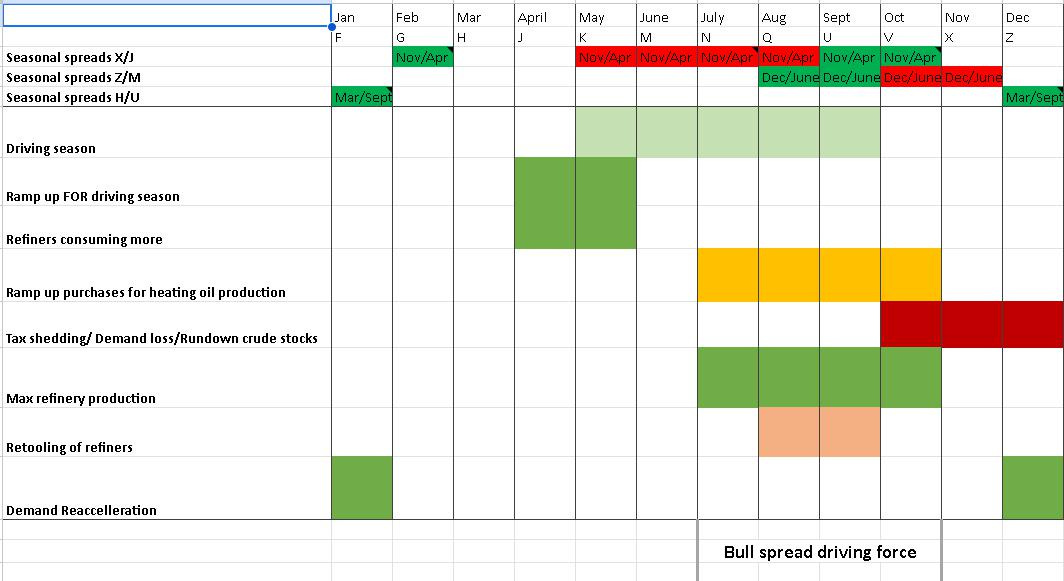
You can see the seasonal demand obviously picking up from January, entering a flat period from late April, then pulling back at the start of summer, before grinding out into highs through September. It is one thing to note this and see it happen year after year; it is another thing to be able to trade this on intraday futures. Trading this curve is one of the mainstays of how I trade oil throughout the year. I execute across the oil curve at various points, basically being long/short on time spreads through this seasonal curve.
If you want more info on time spreads, this is a good resource.
However, it can be broken down in a much more simplistic way, as illustrated by the image below. There are over 35 different spreads that one can trade throughout the year to take advantage of the curve. Here are just a handful of the more commonly traded spreads.
So where does this leave us for trading oil this week and next?
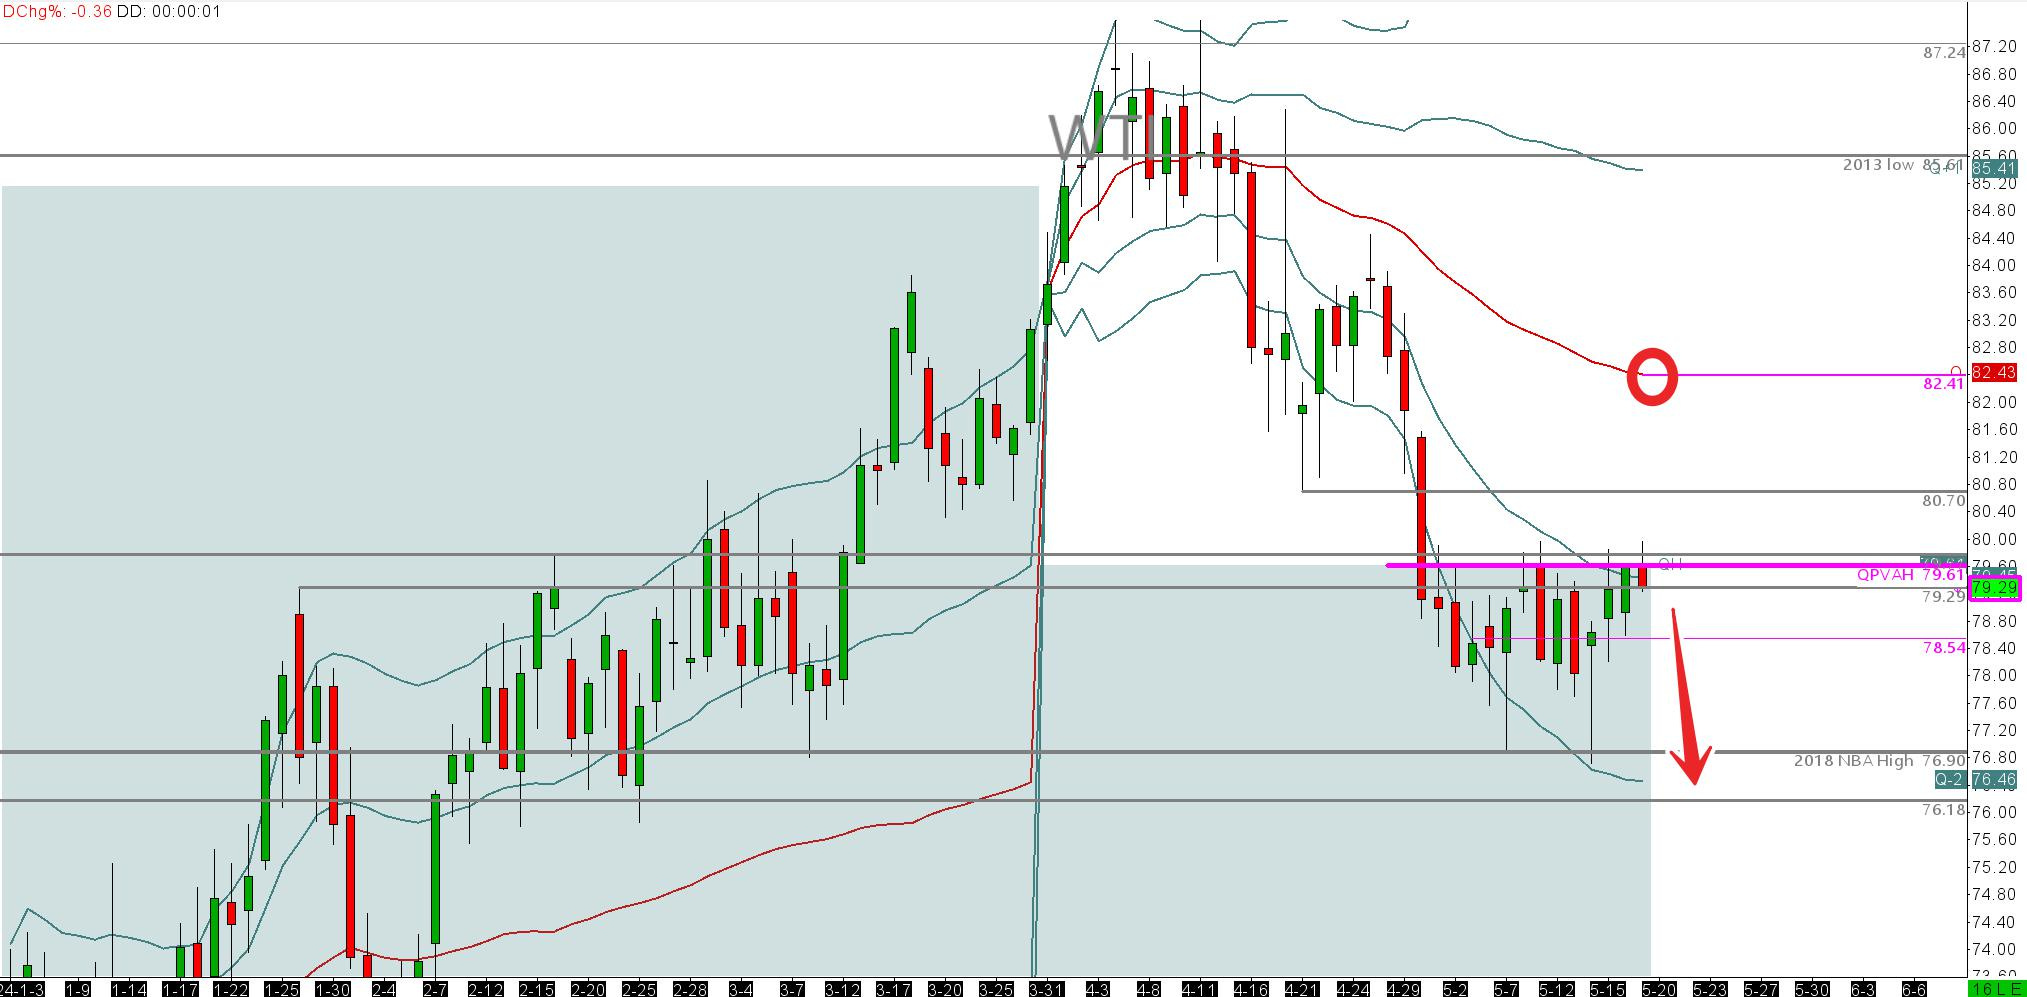
If we look to the daily bar- Quarterly VWAP $79.61, you can see the prior quarters value area high is containing price for the last 12 sessions. The market simply does not have a reason yet to continue to demand higher prices as dcemand is not yet reaccelerating seasonally.
I expect this to come in as we get to trading the last 2 weeks of June. What could temporarily lift us up to test Q-VWAP - Today at 82.43 is a negatively evolving situation in Iran and the subsequent elections that need to take place within 50days of today.
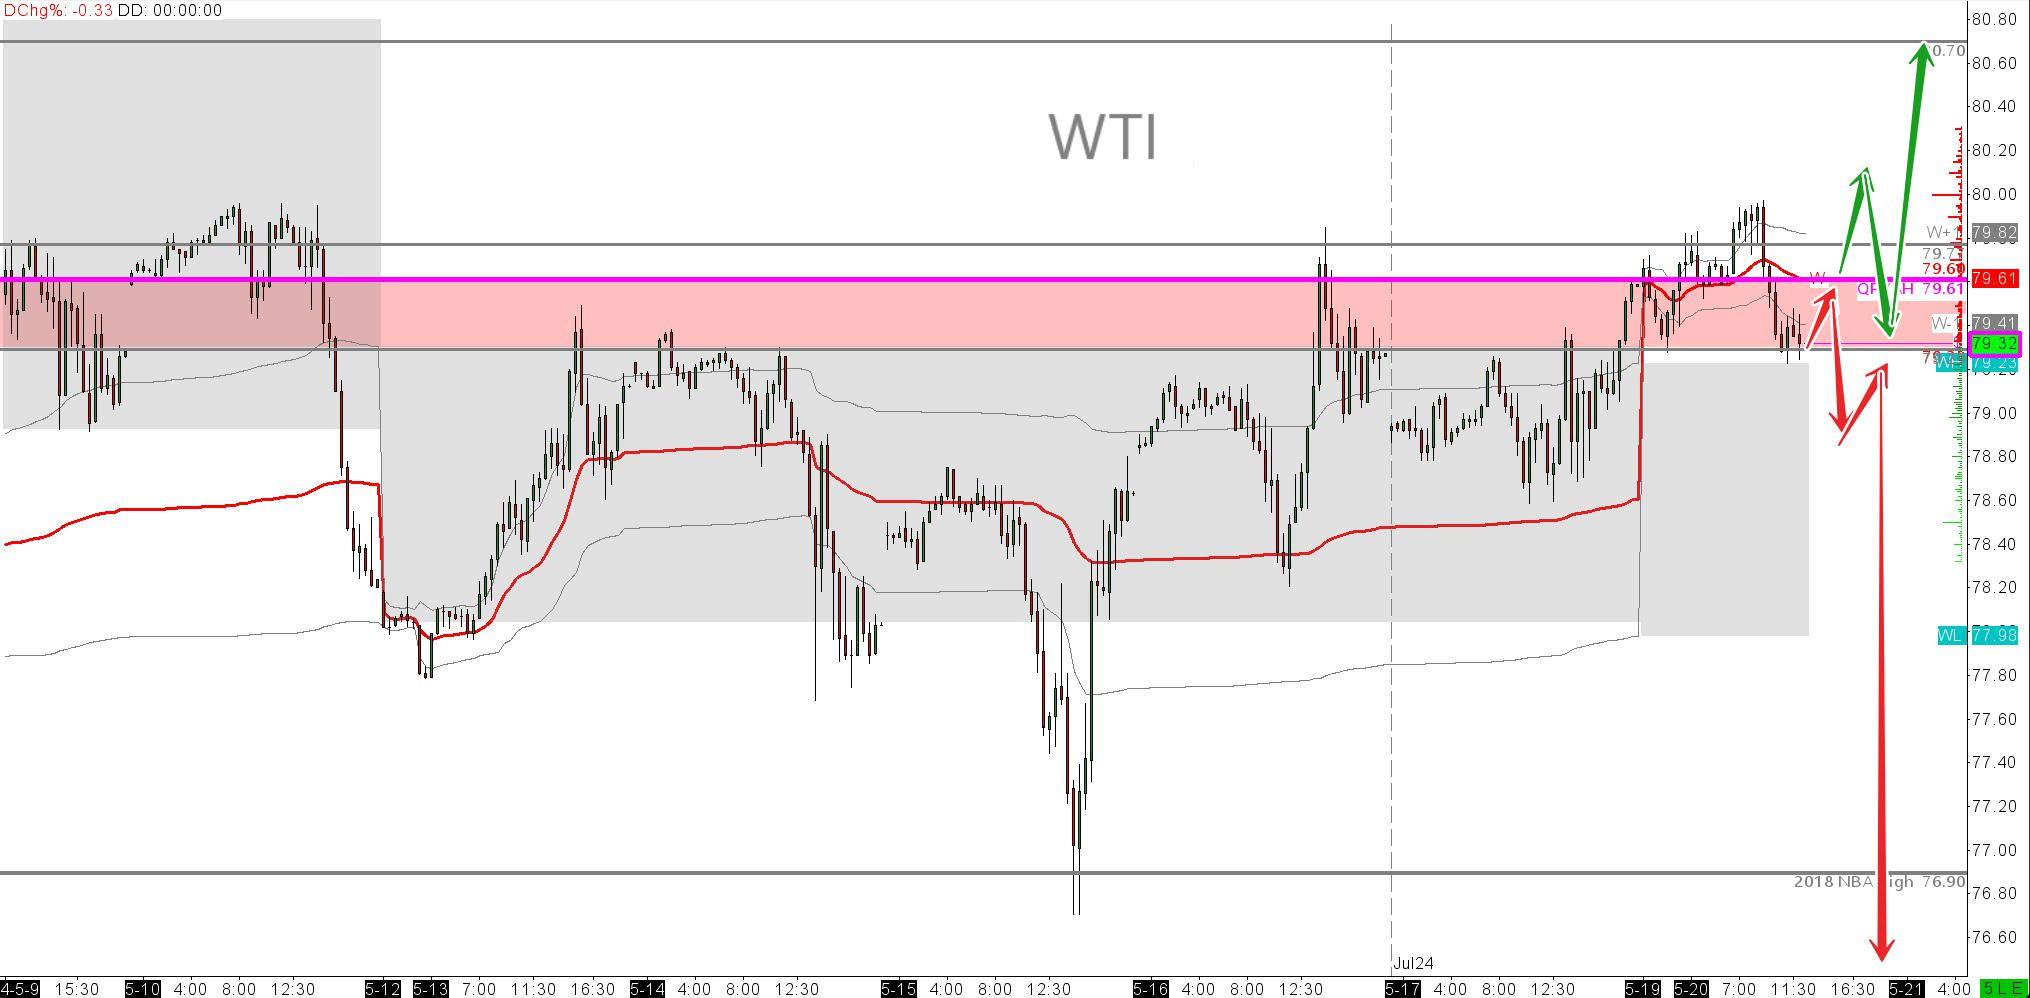
For me, personally I think there has to be SOME premium priced into Oil over this Iranian situiation. I currently dont see this on the price action. The only bullish technical I see is we currently hold over the W-PVAH $79.23. This marks the market as imbalanced up. Ill watch W-VWAP as it evolves throughout today and thge week in order to thus monitor any premium rally. This would bring us up to test Q-VWAP Currently $82.41. Please monitor the Q-vwap level daily.
Below on the 30min chart you can see the type of movements I am expecting out of oil in both an up and down scenario. I will be mainly leaning on $79.61S, $79.30s and $79.23
As always, if you would like to know more, how to setup or use VWAPS and Higher timeframe VWAPS, please do gety in touch. If you are interested in spread trading commodities, I train traders in this and am happy to do a session with those genuinely interested.
Trading is waiting
Waiting is trading.
And as always, keep it tight!


