

Buying this dip?

This report: WTI Oil, ES, Gold
Another Thursday Friday week ahead, with some interesting earnings, however the focus will be on Thursdays US GDP, Initial jobless and Fridays US PCE readings.
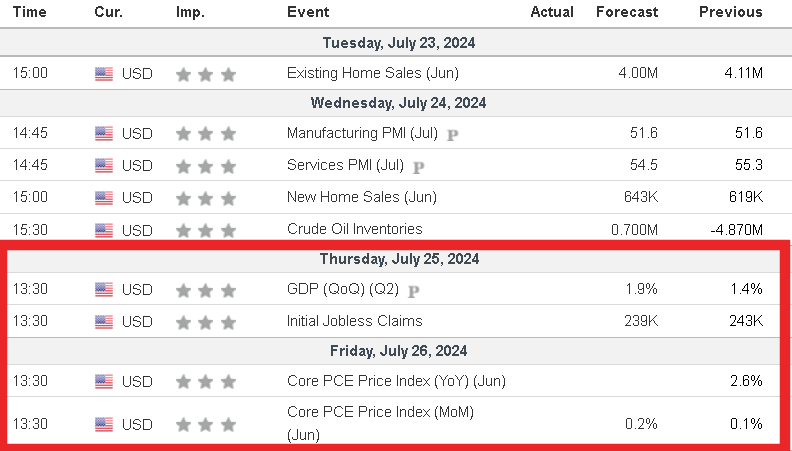
Notable earnings from Spotify, Alphabet, IBM.
We have had some really nice futures markets moves over July so far and last week's action did not disappoint.
On the macro front, The geopolitics is hotting up, entering the storm last week of a post Trump assassination attempt world. I believe the market impact was minimal with very unimpressive action on DXY or Bonds.
When I used to trade in prop, we would regularly trade economic data events, Jobless figures, GDP, PCE, NFP, IEA/DOE, interest rate decisions, central banker speak, or more often than not, a breaking headline. Markets would misprice ore re-price and really move . We would be trading correlations where maybe equities would start to sink and gold would rally, bonds might rally ie. A risk off move or the inverse being a risk -on move- fairly standard behaviour, (over the last 2 years, we see less and less of gold and equities moving inverseley).
Then on rare occasions we would see these moves start, then slow down a little and from the back of the trading floor we would hear the head of trading shout ‘’SELL EVERYTHING’’, warnings us that the corrolated markets were not trading. These moves were normally highlighted by the only things going up being DXY and VIX. We would start to see equities leg down further, gold would also start to give up its bid and come off hard, bonds would also wipe out buyers, there would be no long gold to your short equities or no bond selling with your long equities. no risk on, no risk off, only risk off.
This week gone, we saw one of those types of weeks. Save for 2 markets. Russell and VIX.
The buying we saw into Russell ~(up 3.5% on one day) can only be interpreted one way. Rotation. The rotation out of big cap ES, NQ, DOW, into the smaller cap on Russell 2000 Symbol RTY. I think that this rotation can play out a lot more, but the report this week will be looking at a higher ES and a potential calming for now of this rotation….for now.
ENERGY
WTI U24 (SEPTEMBER)
Please reference the guidance I gave out for WTI last Sunday here.
You can see that our downside target was hit on Friday $78.84, with sellers working off Y+1 $82.75/ Tuesday high area. A 5.12% move from high to low.
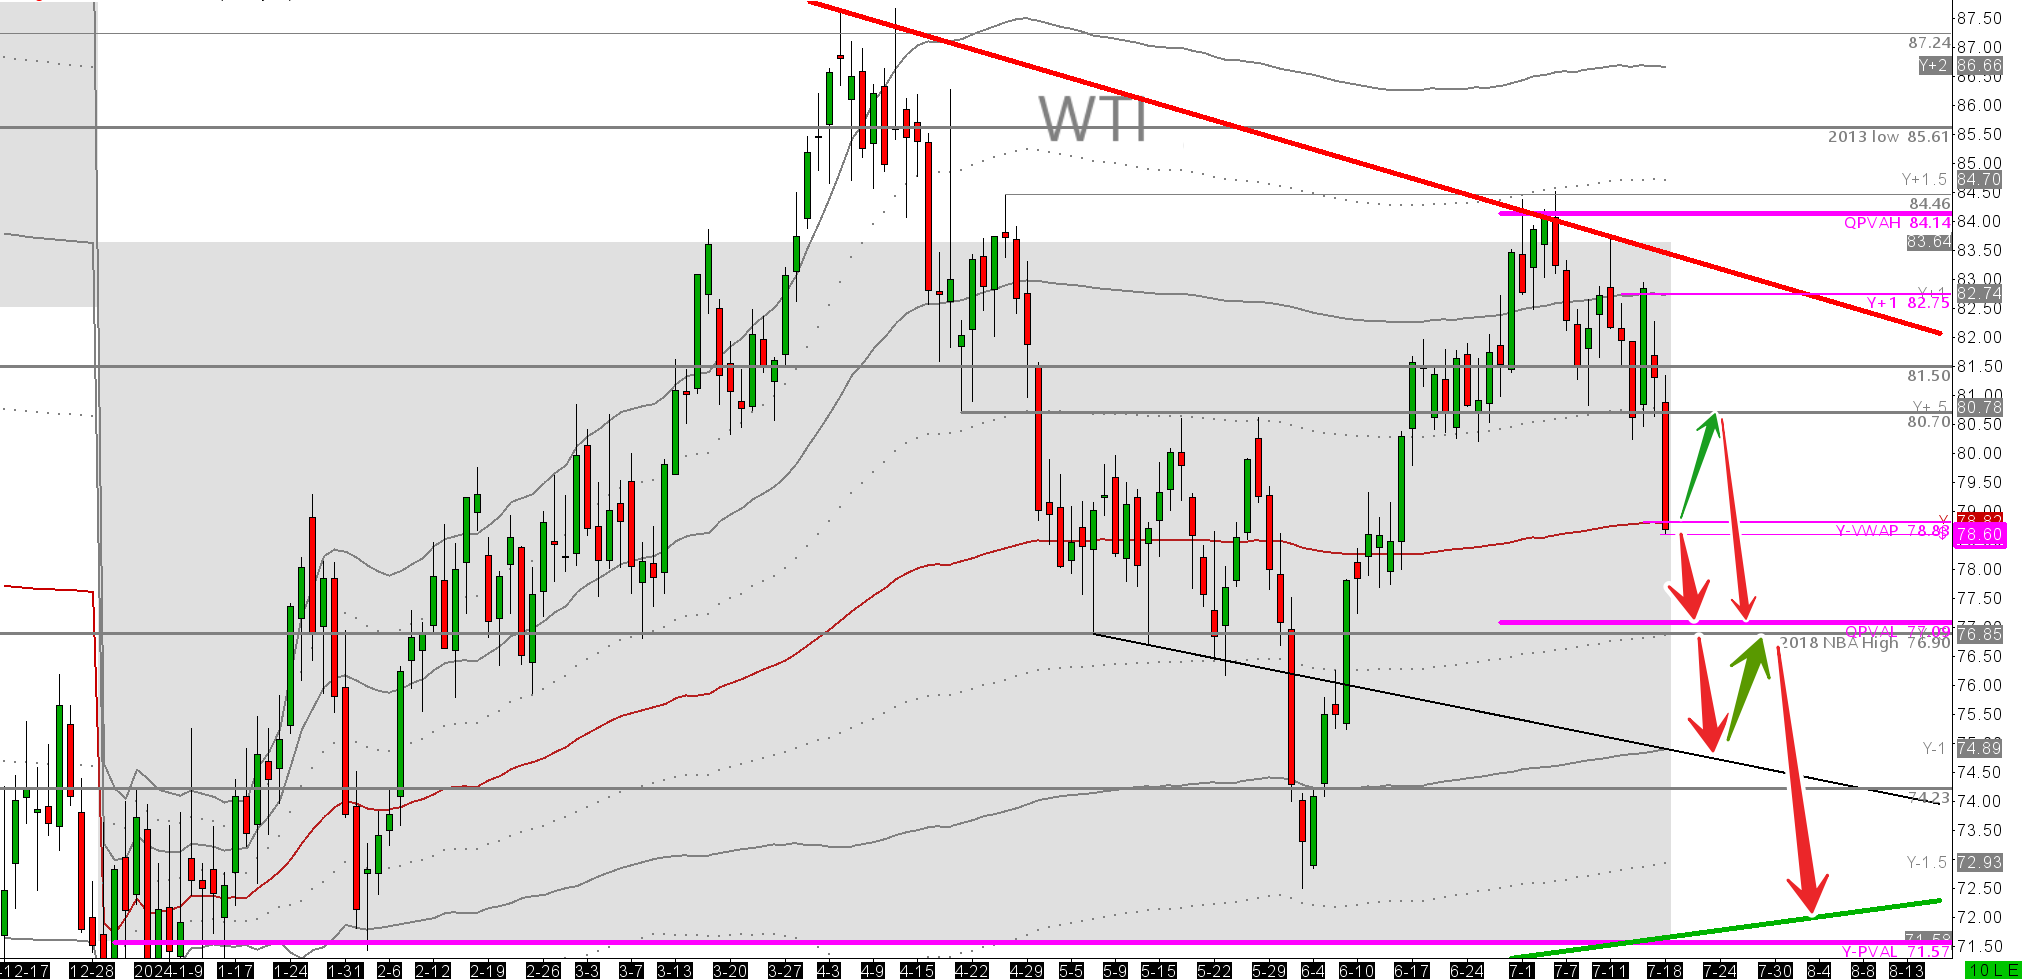
I don't see buyers ready to come in on Fridays lows/Y-Vwap, (but not entirely ruling it out) so I am holding the same guidance as I did last Sunday, in that if we don't bounce from Y-VWAP, we will trade down to Q-PVAL $77.09. I think there will be some form of bounce to find renewed selling a little higher up, but that would most probably be around MPVAH $81 then the extended move down can happen.
CONTEXT
We are auctioing down on the Yearly PVA and should be selling rips, not buying dips until we trade large other contextual levels ie. Q-PVAL $77.09.
CONDITION
We are flat balanced on the year. Sellers working off Y+1 $82.74 Will want to drive their position to Y-1 $74.89
The Trade
If we trade Q-PVAL $77.09 before we trade $80, I'm a buyer at Q-PVAL area. (Please also be aware that the Q-PVAL is confluent with the 2018 non back adjusted high $76.90). Look for a double tap support on the 30min bars of this price to get long. The market will be imbalanced down on Day, week, month, so you will be fighting context. A tough trade, a retracement type of trade. If you get stopped out, don't fight it and accept your risk loss within your risk parameters. Trade this long back up to around y-vwap and de-risk there. This really could be a great one and done for the week type of trade.
For the bears, it will be a tough call to jump on more selling at such an extended low point. If we trade on Q-PVAH, you will be fighting a wall of buying power, so do the selling from an extended point above here. ir. a retest from below of Y-VWAP or near there.
ES U24
As talked about, we are seeing early on set rotation out of big cap and into small cap. The pullbacks on big cap are no surprise. We are all hopefully aware of stock concentration whereby the mag 7 accounts for pretty much all of the gains on ES over the last 12 months. The price target for NVIDIA on the upside was $1400 when we were trading $920 NVDA. The stock has since split 10:1, so the target then became $140.
Have a look here at the current top in NVDA $140.76.We can clearly see this price target of $1400/ $140 has been hit. The great run, FOR NOW, is over. We need to reload fresh buyers lower down.

What is my point? Its that AI and the AI adjacent stock rally is done ... .for now. People buying the current pullbacks are simply providing exit liquidity for people who have been long. I see NVDA coming back to around $80 (50 week EMA) before we get new all time highs. So if that is my base case, then I see the stock concentration effect on ES, NQ, about to normalise. This means, lower.
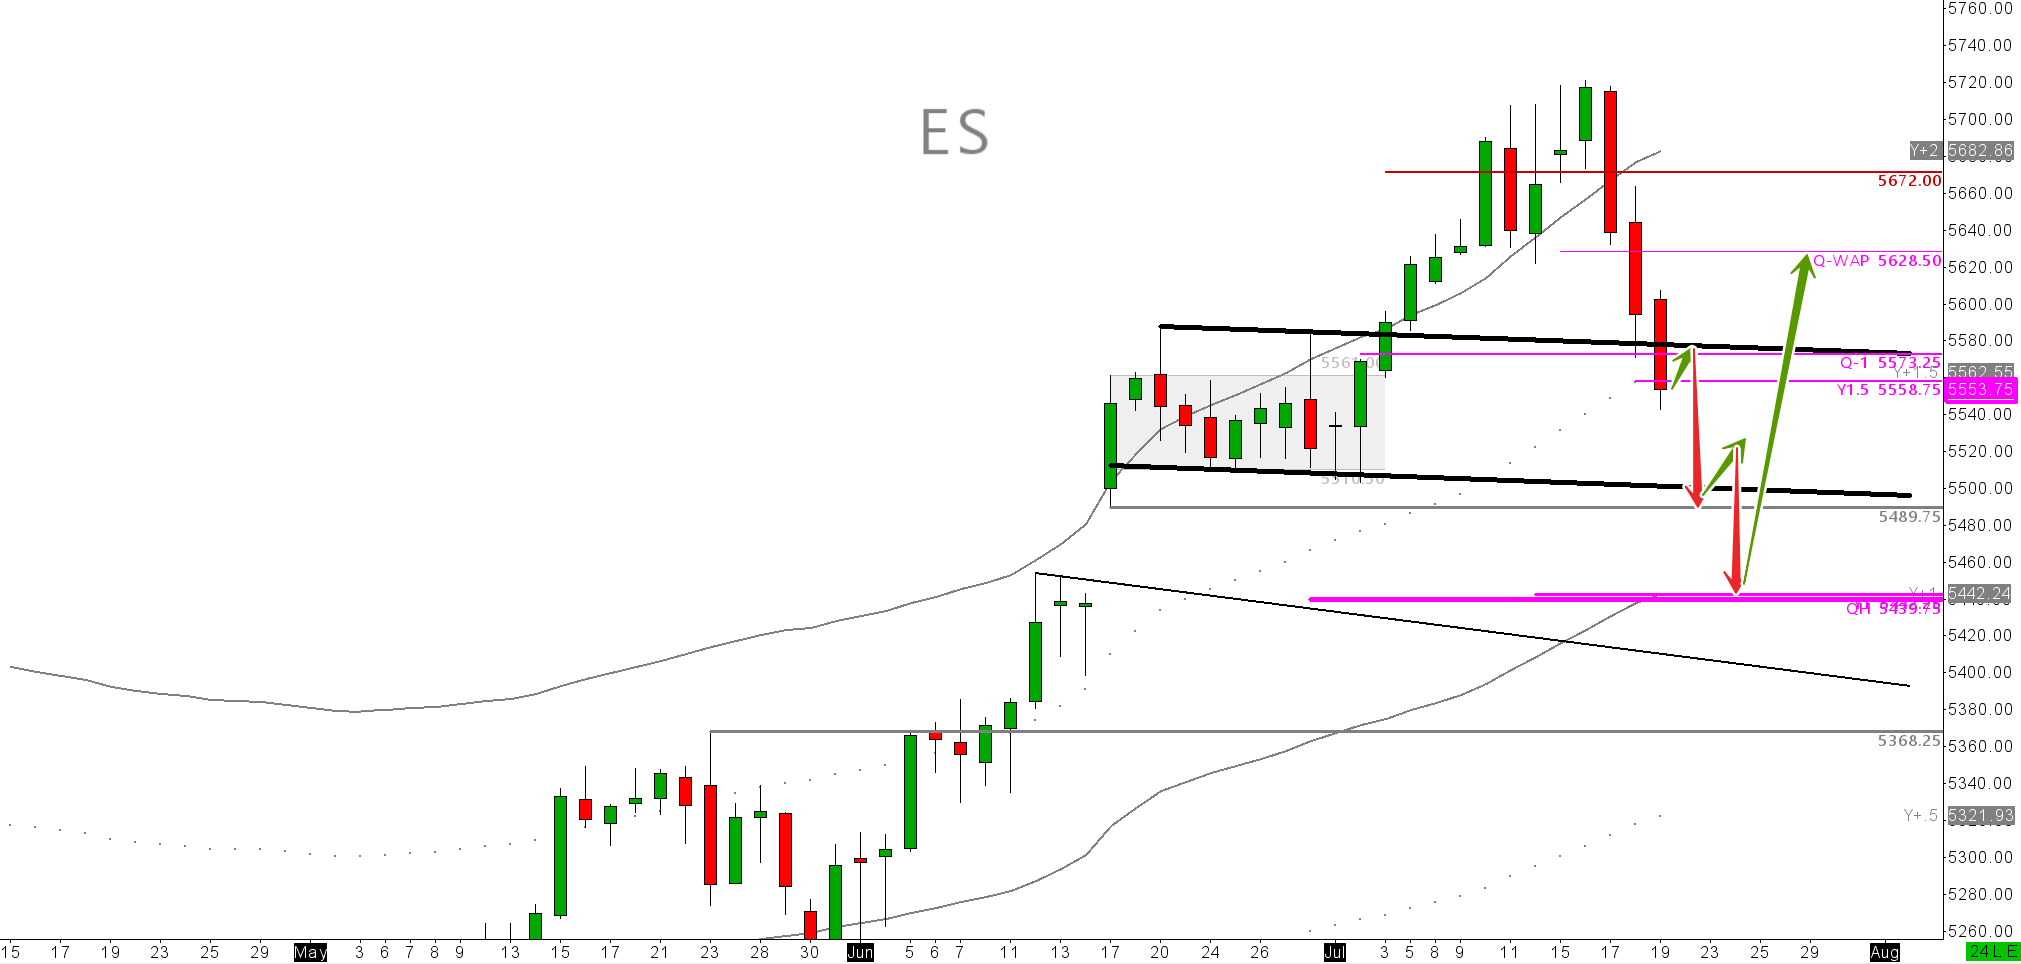
The daily bars Yearly VWAP tells me we need to trade back to Y+1 Currently at 5422.24, confluent with Q-PVAH. $5439. There is too much concentration of average pricing at this area for the market to not trade there and fast. The faster we can get there, the faster we can start to re-rally on ES. This is simply where the largest average price interest is going to be.
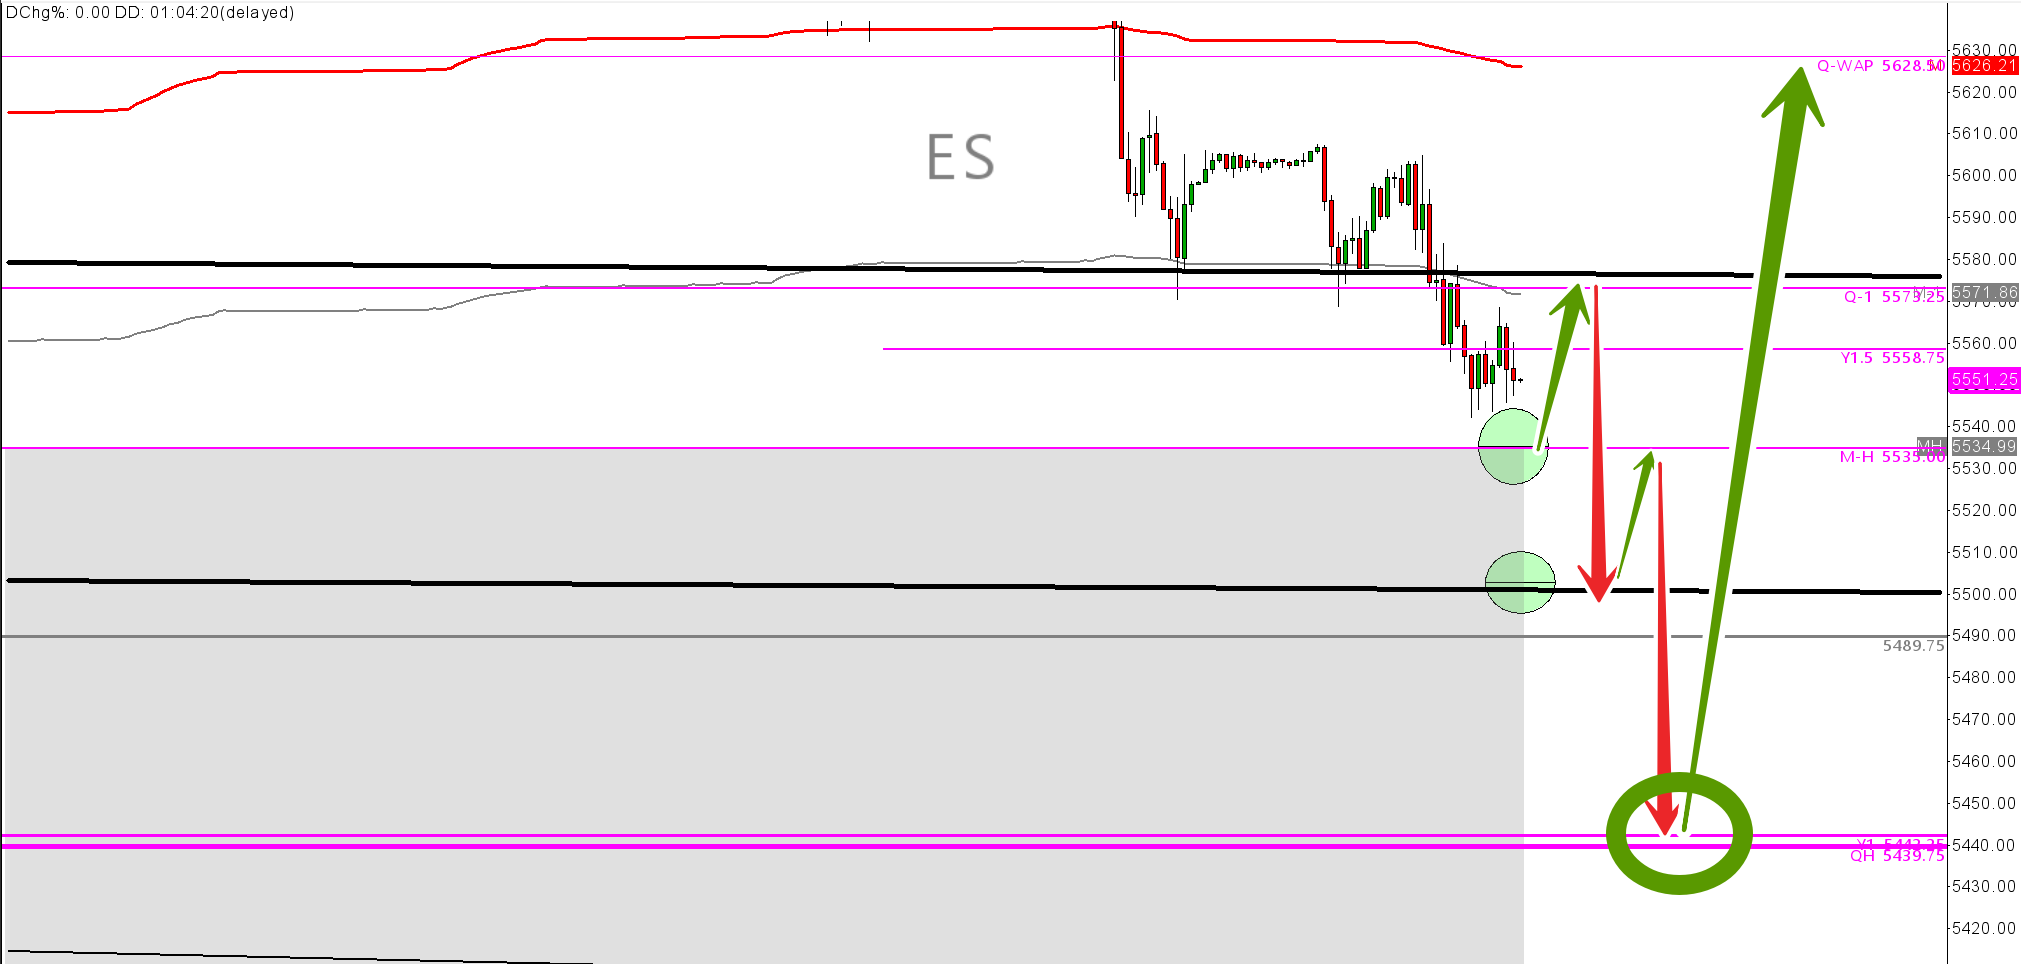
From the 30 mins chart, you can see that we broke down hard on Monthly VWAP, crashing down to my targets from last week's report. Buyers however have simploy not been getting anywhere since that target was hit. Monthly PVAH will attract some buyers, however they will handed sick bags in my estimate. The safer trade for me is to sell rips from buyers at MPVAH $5344 and buy dips on $5439s.
Context.
We are IB- Imbalanced up on the Year and month. We are IB Down on the quarter. Keep in mind we are onl;y month 1 of Q3. Meaning I would rather trade the Q condition than the Month.
Condition
We are IB Up on the year. Need to reload buyers on Y+1. Currently $5442. OR Need to reload sellers at Q-VWAP Currently $5628.50
The Trade
Sell rips to Q-VWAP 5628.50. Best to have it trade first before looking for shorts.
Buy dips to Y+1 $5422/ Q-PVAH $5439. These are not small trades. The run from either of these positions should yield a minimum of +500 ticks for the Q-PVAH long, and -710 ticks on the short. DO NOT SELL THE Q-VWAP If we have already traded Q-PVAH.
GOLD
GC Q24
While It is well advertised that China has been a huge buyer of gold recently due to their economic woes, it doesn't tell us anything about how to trade and make money out of the product. Gold is a tricky trade. As mentioned at the top of this report, there are correlations at play, gold over the last 2 years has actually moved inverse to the real yield. Put in simple terms - Gold trades with the US 10 year bond. If the bonds move up, Gold moves up. This is not a tick for tick correlation. There are periods where gold will untangle itself from the correlation and price in equities risk ie. Gold up, equioties down, however this is not an easy trade to get on. The best thing to do is to ignore all of this and trade the condition and context oon Gold and look to US10 year to support or deny gold its moves.
Context
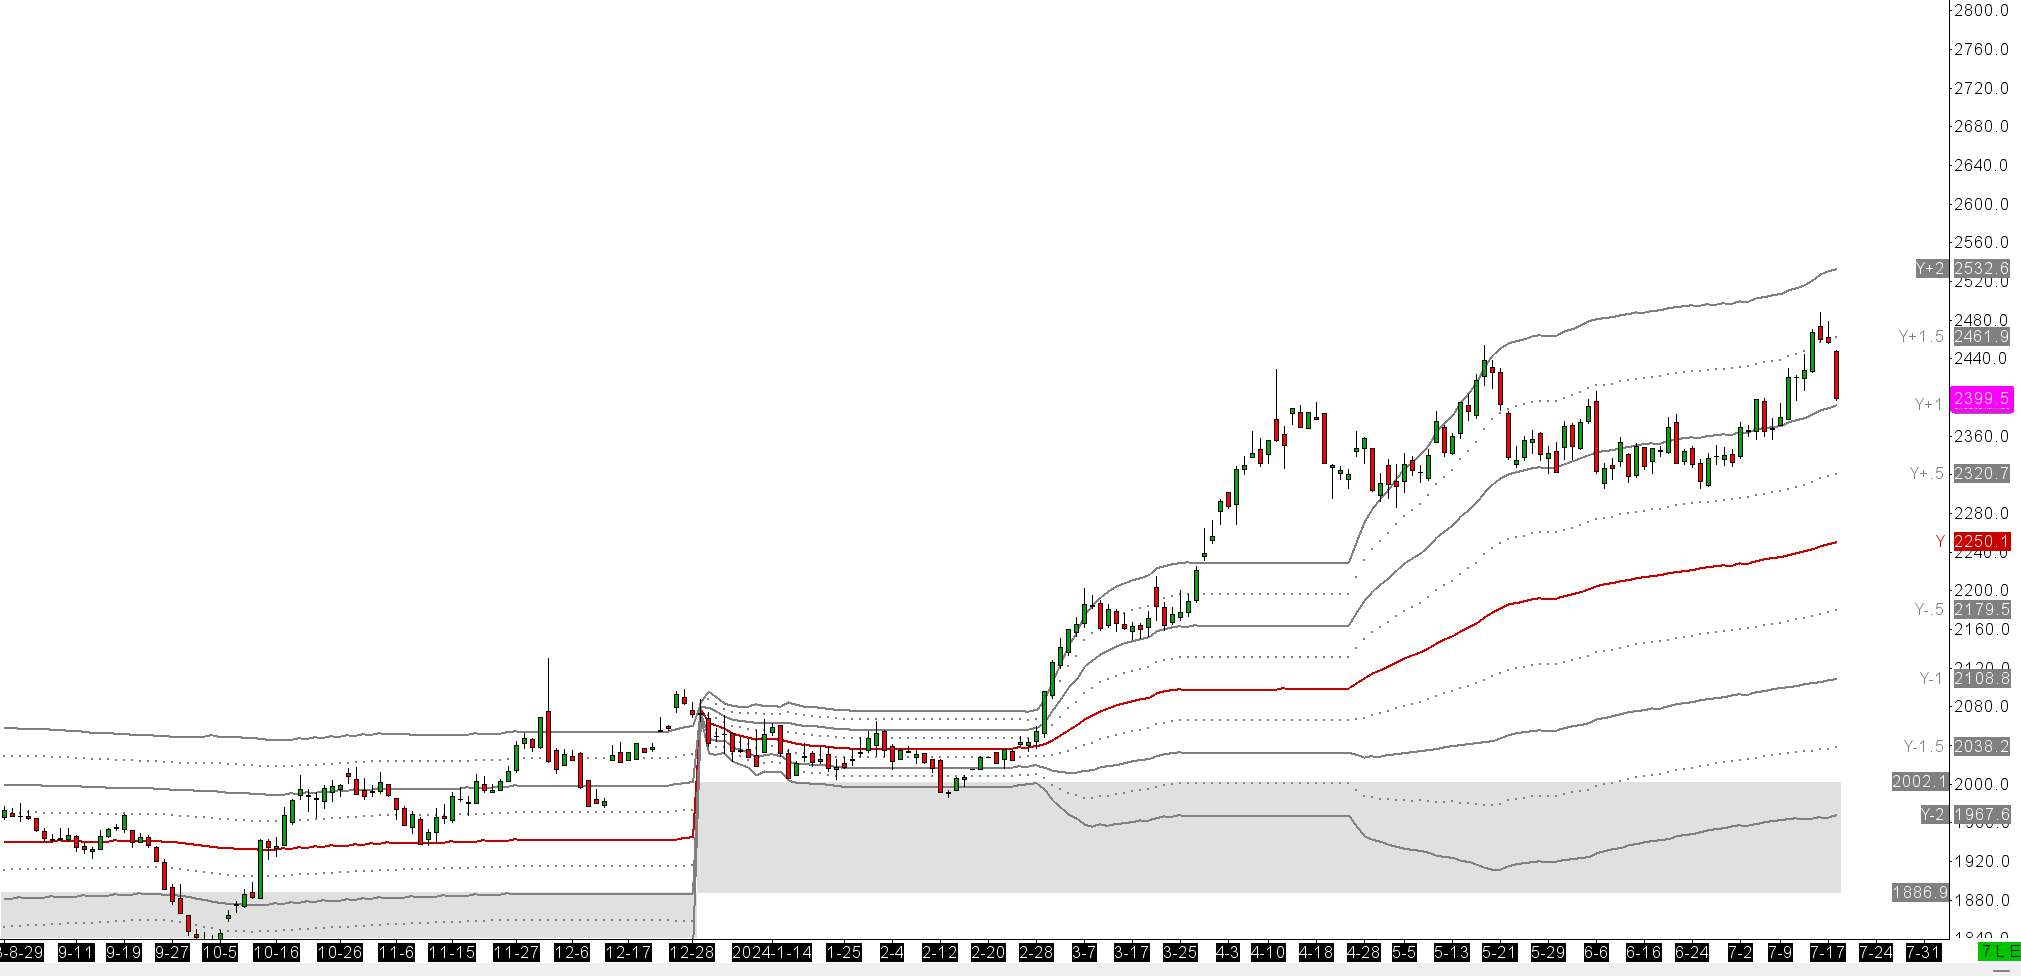
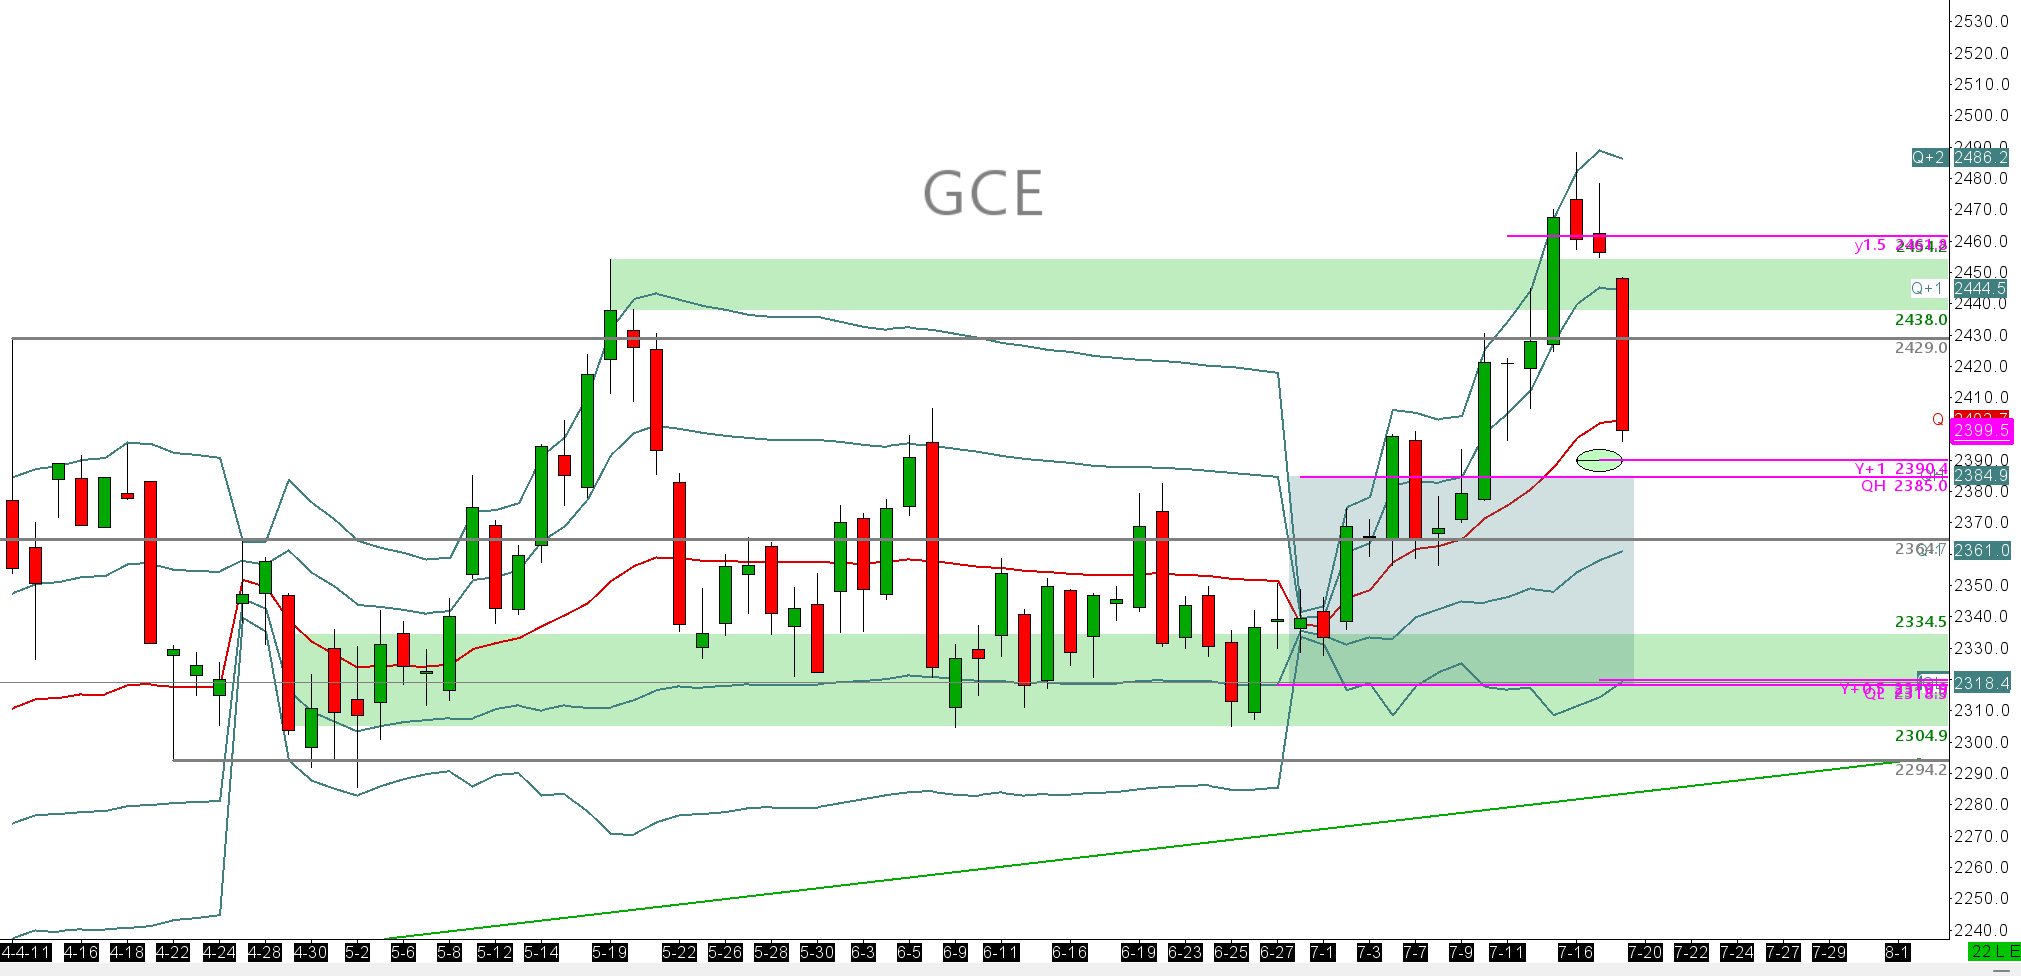
We are IB Up on the Month MPVAH and Q QPVAH. We are grossly IB Up on the year. See chart. We should therefore expect the context to stay up on these periods. Buying sips against these levels should yield further upside.
Condition
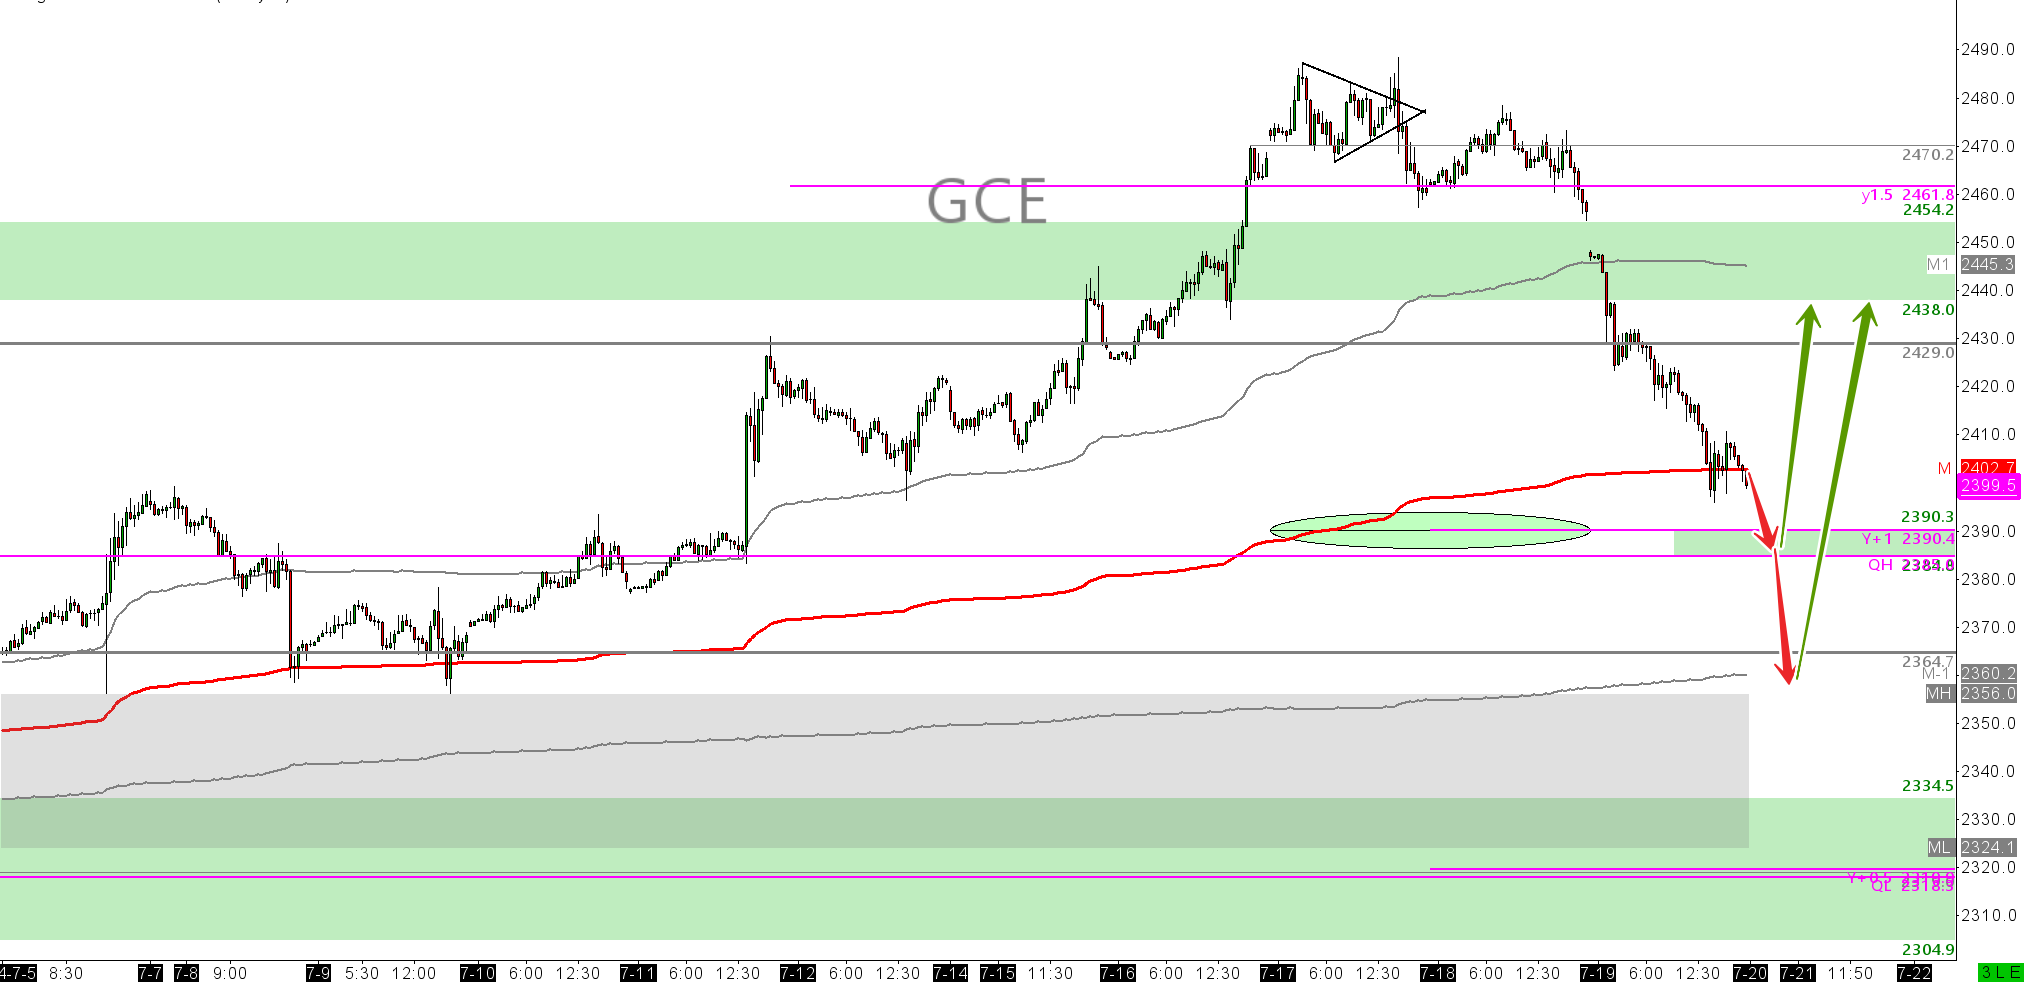
We are pulling back to Y+1 $2391 and are IB Up. Quarterly PVAH IS$2385. So this gives us a nice interesting zone where buyers should come in. HOWEVER, Monthly PVAH is not that much lower at $2356. So if we slip under the Y+1 & Q-PVAH, this is where buyers will fade sellers.
The Trade.
Buy Q-PVAH $2384 or MPVAH $23356.
Sell M+1 $2445/ Low of range $2438.
It is ALWAYS the same with inexperienced traders, they always want to know why a move happened. More often than not, because they jumped on a large green candle that quickly became a big red candle shortly after their overly eager long entry. In my experience, it is 100% useless to be asking why a move is happening if you dont already know. Find out later. Dont trade it if you dont know. It is more useful to know what the local content of a market is. Is it balanced up?
This means that it was recently trading expensive but now, the prior highs are considered cheap. Or are we trading balanced down, where recently considered low of range ie. cheap, is now expensive and we will move down. Think about this in the context of support becoming resistance, resistance becomes support. I do a free lecture ‘Technical analysis 101 signup and access is free. While incredibly simple, matched with context areas and condition/vwaps, it is incredibly powerful. More indepth and technical breakdown of Auction Market theory and context as I use it here as part of the Alpha Edge training.
I also have an advancepd VWAP trading course here.
As always, keep it tight on the risk out there. This is all you have to stop yourself driving off the cliff. Stay tuned to the youtube for technical lookahead videos or psychology videos I plan to record over the coming weeks. Come September I will have a lot more time to put out more content.
Until next week my friends

3 Month Alpha VWAP course. 3 months at £275 or £825 one of.
12 Month Alpha Edge Course. 5 days free trial £250per month or £3000 one off.
4 Week Alpha Pro Course. 4 Weeks intensive learning.
Ill take one dip and a basket of $VOO please. All downside targets hit and bought as per this weeks VWAP report
Long target hit ON ES and we are now on way back up. $5439 long