

Thursday/Friday week
A Thursday Friday kinda week!

Earnings this week from Sales force, Costco, Dell, Marvell, Ulta Beauty.
https://www.tradingview.com/markets/stocks-usa/earnings/
The week is off to a pretty slow start with US Memorial day Monday. Tuesday and Wednesday nothing to look at really. The market will wait for the busy data Thursday and Friday.
Monday, All Day Holiday United States -
Memorial Day,
FOMC Member Williams Speaks
Tuesday, May 28, 2024
FOMC Member Bowman, Mester & Kashkari Speaks
Wednesday, May 29, 2024
USD FOMC Member Williams Speaks
Thursday, May 30, 2024
USD FOMC Member Bostic, Member Williams Speaks
USD Core PCE Prices (Q1)
USD GDP (QoQ) (Q1)
USD GDP Price Index (QoQ) (Q1)
USD Initial Jobless Claims
USD Pending Home Sales (MoM) (Apr)
USD Crude Oil Inventories
USD FOMC
Friday, May 31, 2024
USD Core PCE Price Index (MoM) (Apr)
USD Core PCE Price Index (YoY) (Apr)
USD PCE Price index (YoY) (Apr)
USD PCE price index (MoM) (Apr)
USD Personal Spending (MoM) (Apr)
USDFOMC Member Bostic Speaks
ENERGY
WTI OIL CLN24
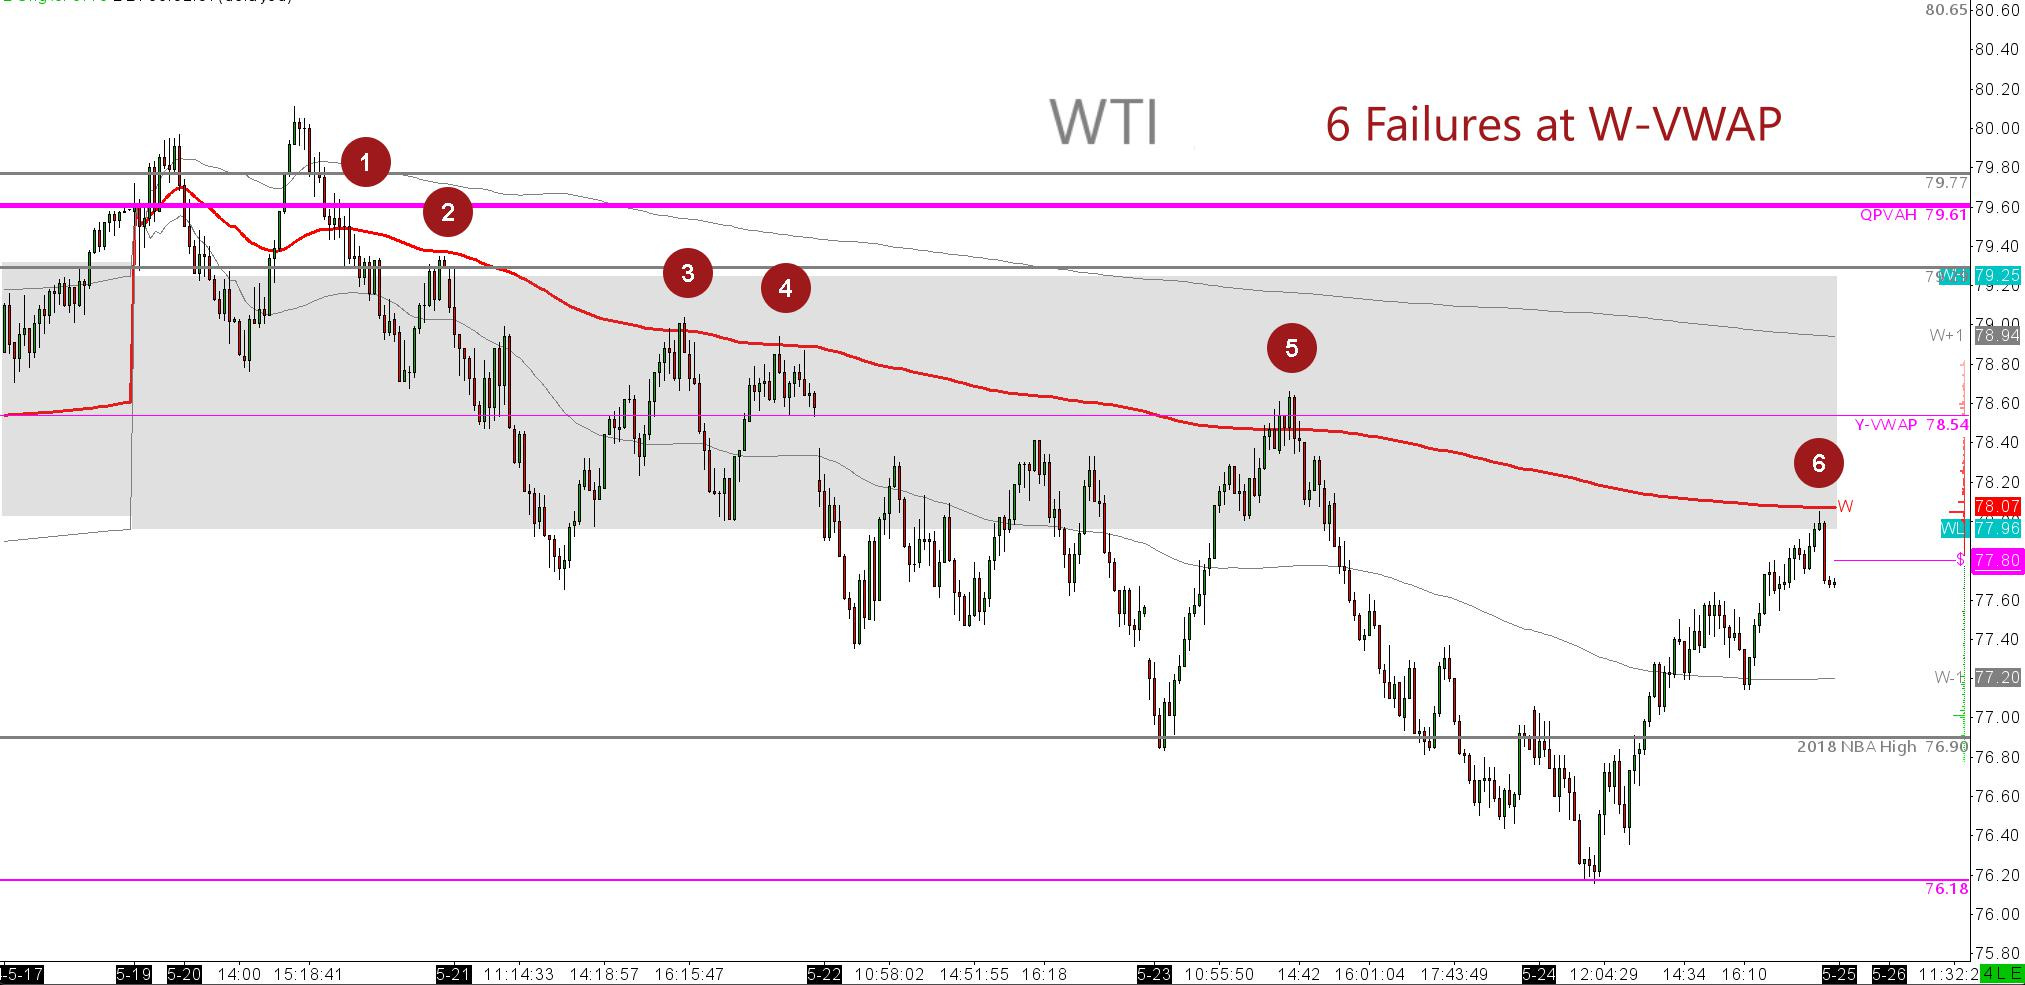
Last week's selling seemed to catch quite a few by surprise, with a notably negative market right from the start. The small premium regards Iran never materialized as the situation remained muted, but this didn’t stop us from getting into shorts early in the week and then scaling in on extremely good, clean pullbacks to the Weekly VWAP.
To reiterate, I shared my trade thesis for the week from the 30-minute chart below. I indicated that I would be leaning long or short against $79.61, $79.30, and $79.23. As you can see, this strategy played out, with the market heading south due to the continued exit of the war premium.
I remain bearish in the medium term, up until we get a reacceleration of refiners purchasing activity due to come in around the 11th June. This is when I will be loading up on specific time spreads on WTI long.
For the week ahead. I'm looking at the dynamic not changing too much, however this is oil, so we must remain attentive to geopolitical risks. If we are to be a slave to our process, we will be selling pullbacks that will be fueled by last week's cheap prices. I think I would like to not look too shallow. I would like to see the market try and fail to close over Yearly VWAP, now at $78.48s. I will want to get into weakness here utilising my daily or weekly VWAP at the time. Patience would have paid out last week and indeed this week should be no exception to that.
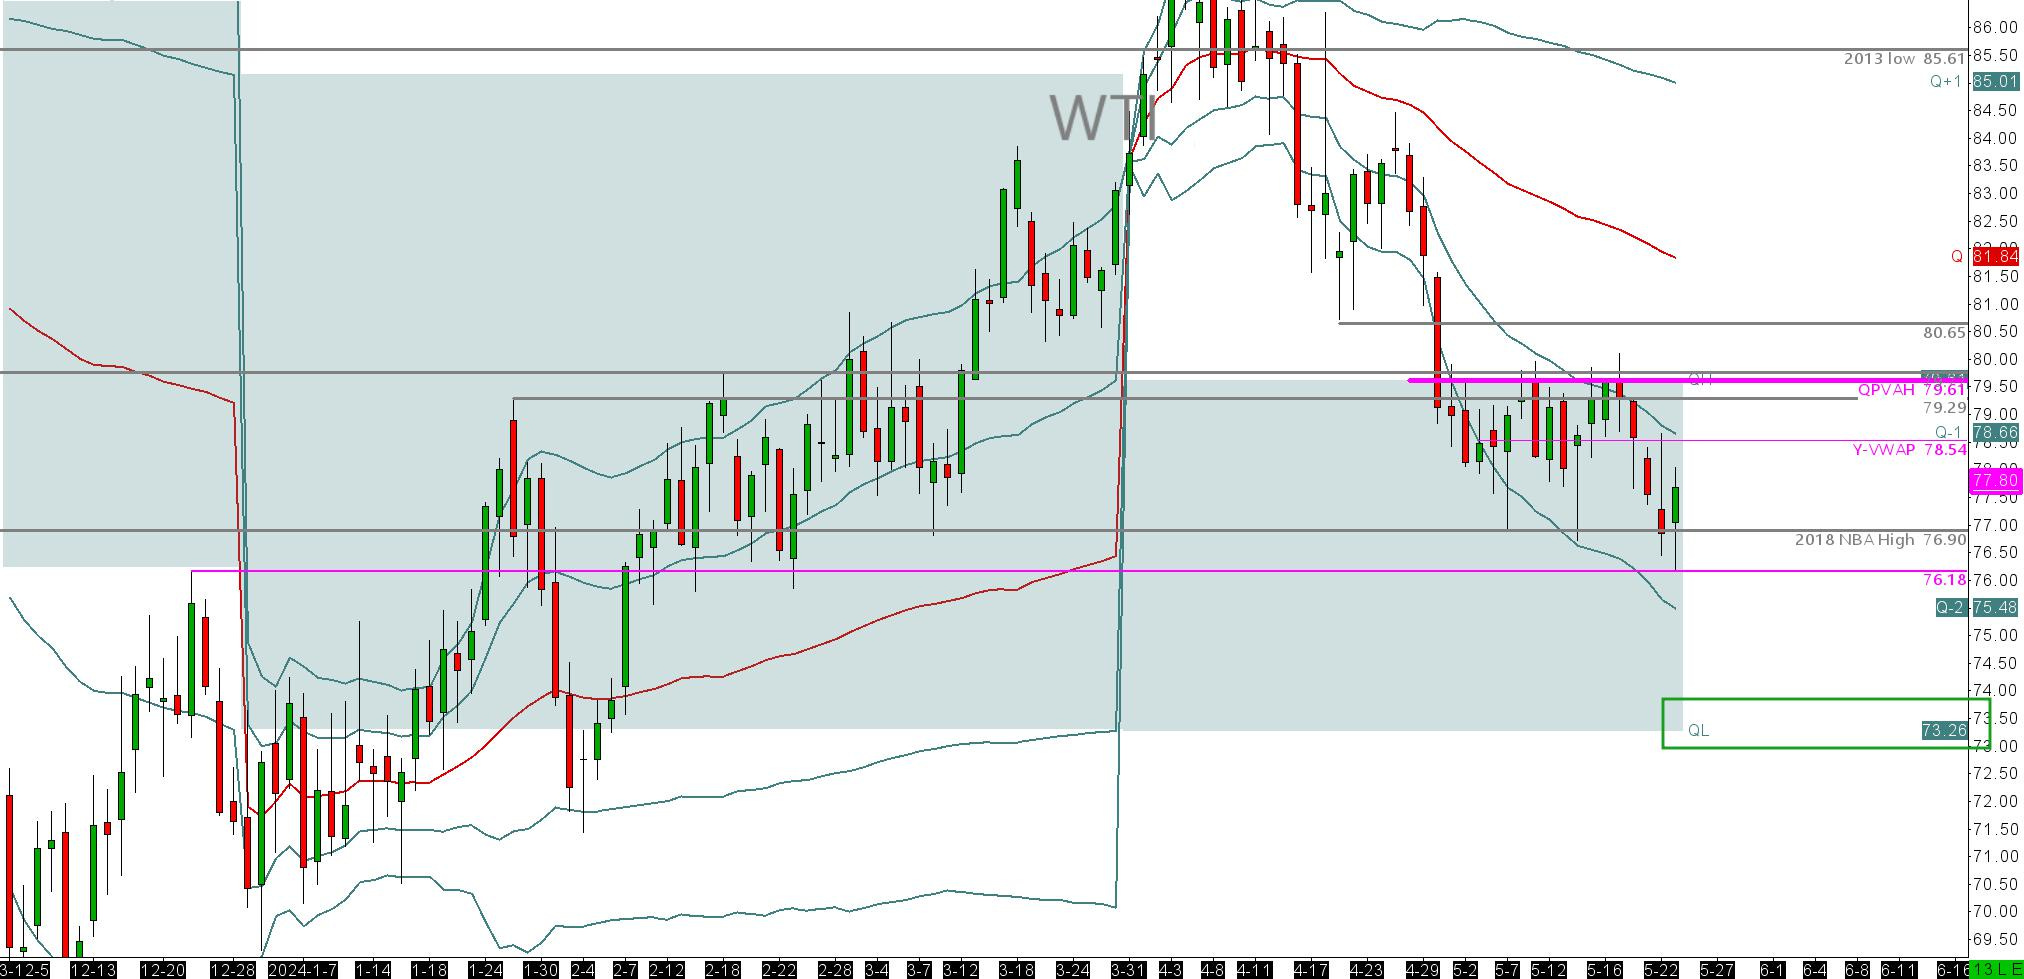
If we get over Q-PVAH $79.61, I will let the market rally look for weakness to sell at either q-vwap CURRENTLY $81.84. This level will move down as the hours go by on the week, so you must track it hourly. My destination on the downside for the week is the Q-PVAL (Prior Value Area Low) $73.26
Waiting to fade a massive move back up like this can keep you out of the market for a number of days. There will be trades to take on the short side should we not manage to spend a few 30min auctions ie. opens and closes above specific levels. If you are having trouble reading if a market is strong or weak over a level, just use the method of seeing if the 30min auctions ie. bars are opening and or closing above or below the level. Above it, = strength, below= weakness. Simple! I like to use the prior day's value based on volume. It may seem like a lot to think about all this, but please get in touch or drop a comment.
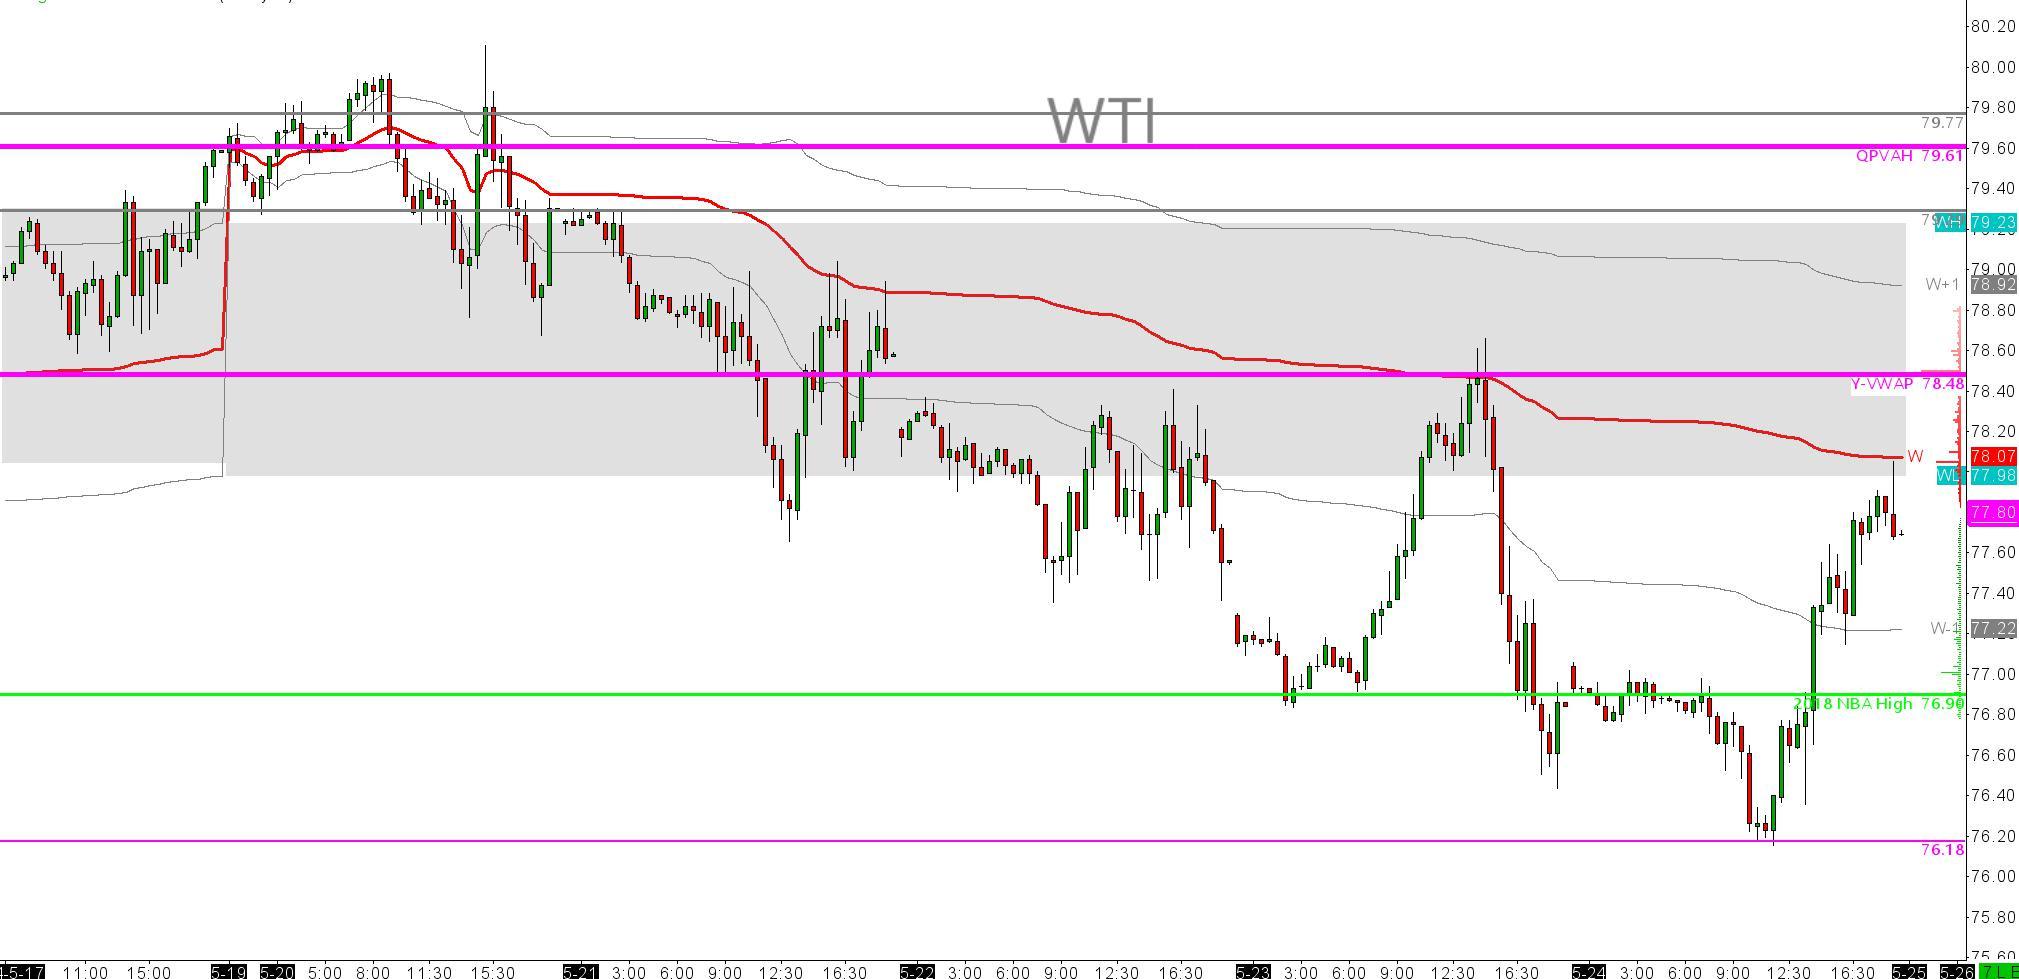
We can see on the 30min there are some significant levels. YVWAP $78.48 & Q-PVAH $79.61. I am less likely to trade these to the tick and more motivated to trade them against daily levels ie. Prior days high or low, ETH VWAP (electronic Trading Hours VWAP).
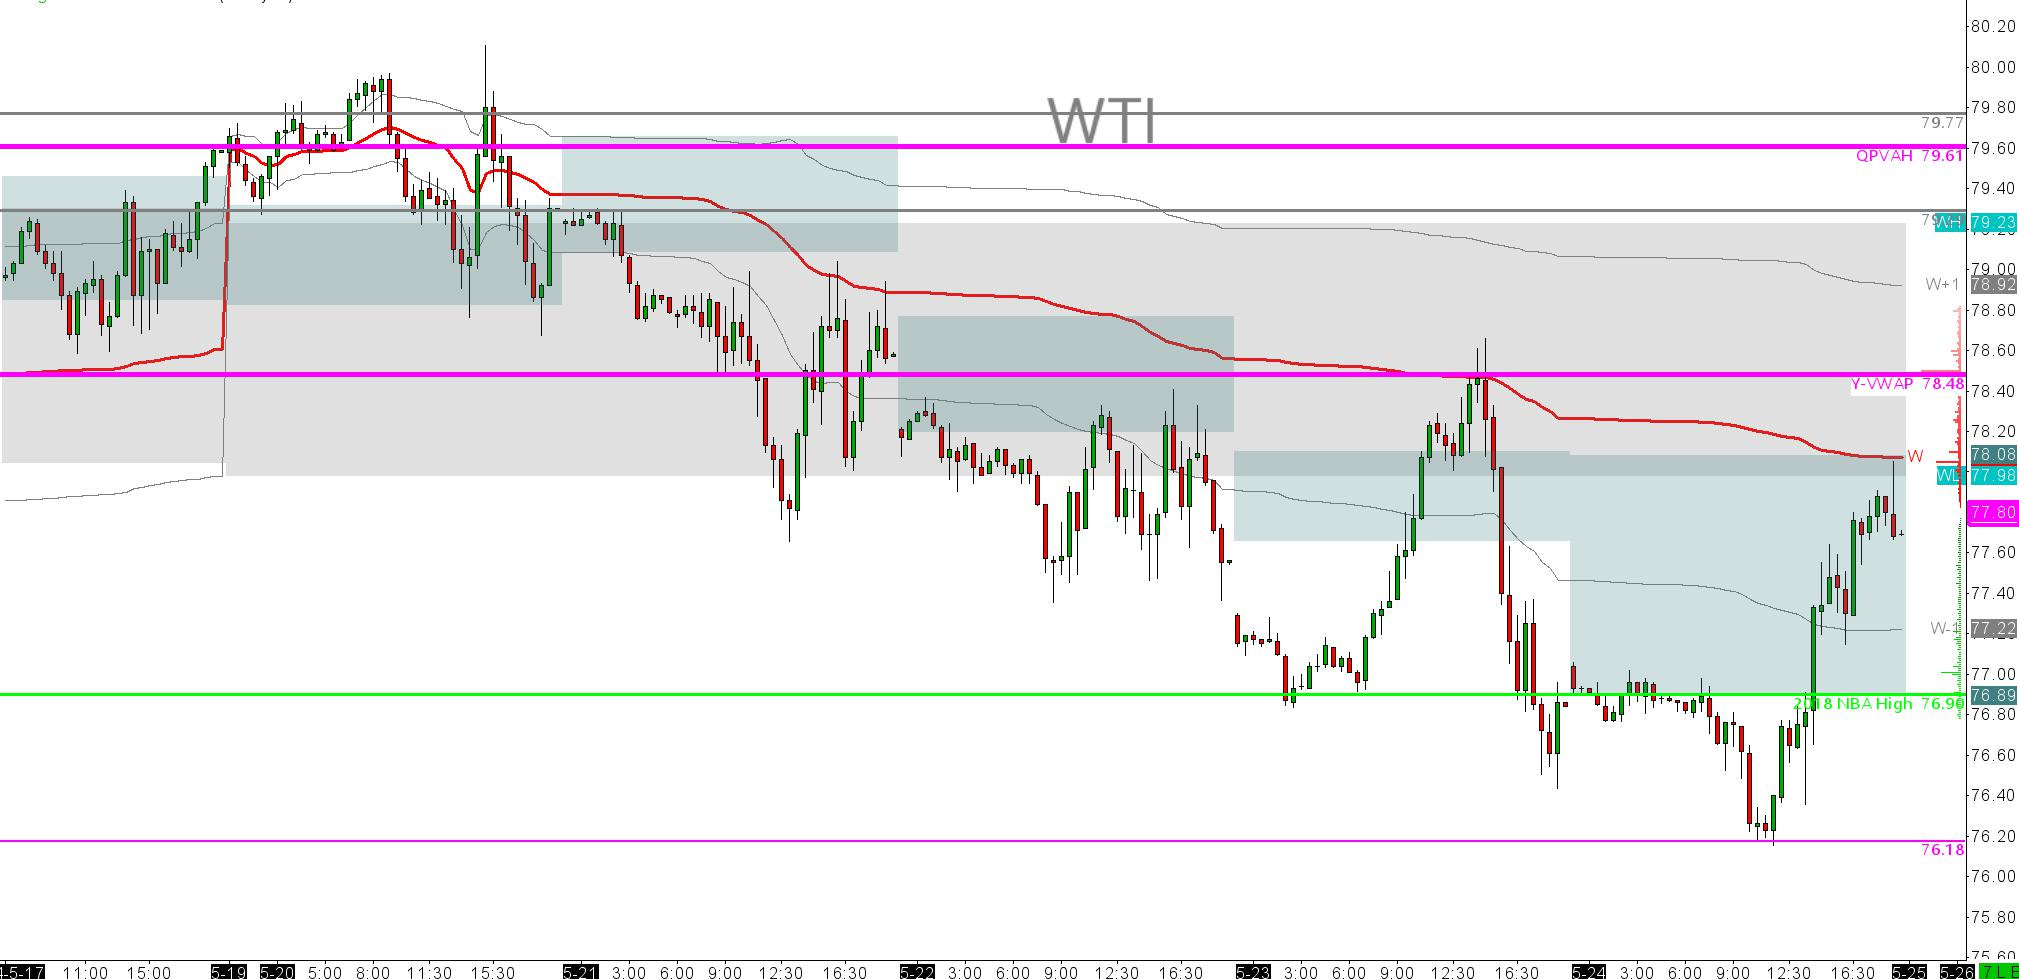
Below you can see what the chart looks like with just weekly VWAP , then the daily value areas overlaid. I'm not going to add the ETH VWAP as it can get overly complex a picture.
NAT GAS.
Henry Hub Nat Gas has been beaten up for the most part of the past 12 months. A flood of North American supply has washed out prices with many talking about the contract going to $1, $0 and in some crazy cases, below zero.
Good breakdown from NASDAQ.com here
However in energy and commodities overall, nothing solves low prices like low prices. ie. If the contracts go so low, more buyers over time become interested, the cheap price market becomes satiated and natural order kicks in again. Mother market doing her thing. It is no secret that Nat Gas is one of the transitional carbon sources that can get us away from heavy fossil fuels. Less oil, more gas, then we can transition to electricity or avocado skins or whatever to get to net zero around the globe.
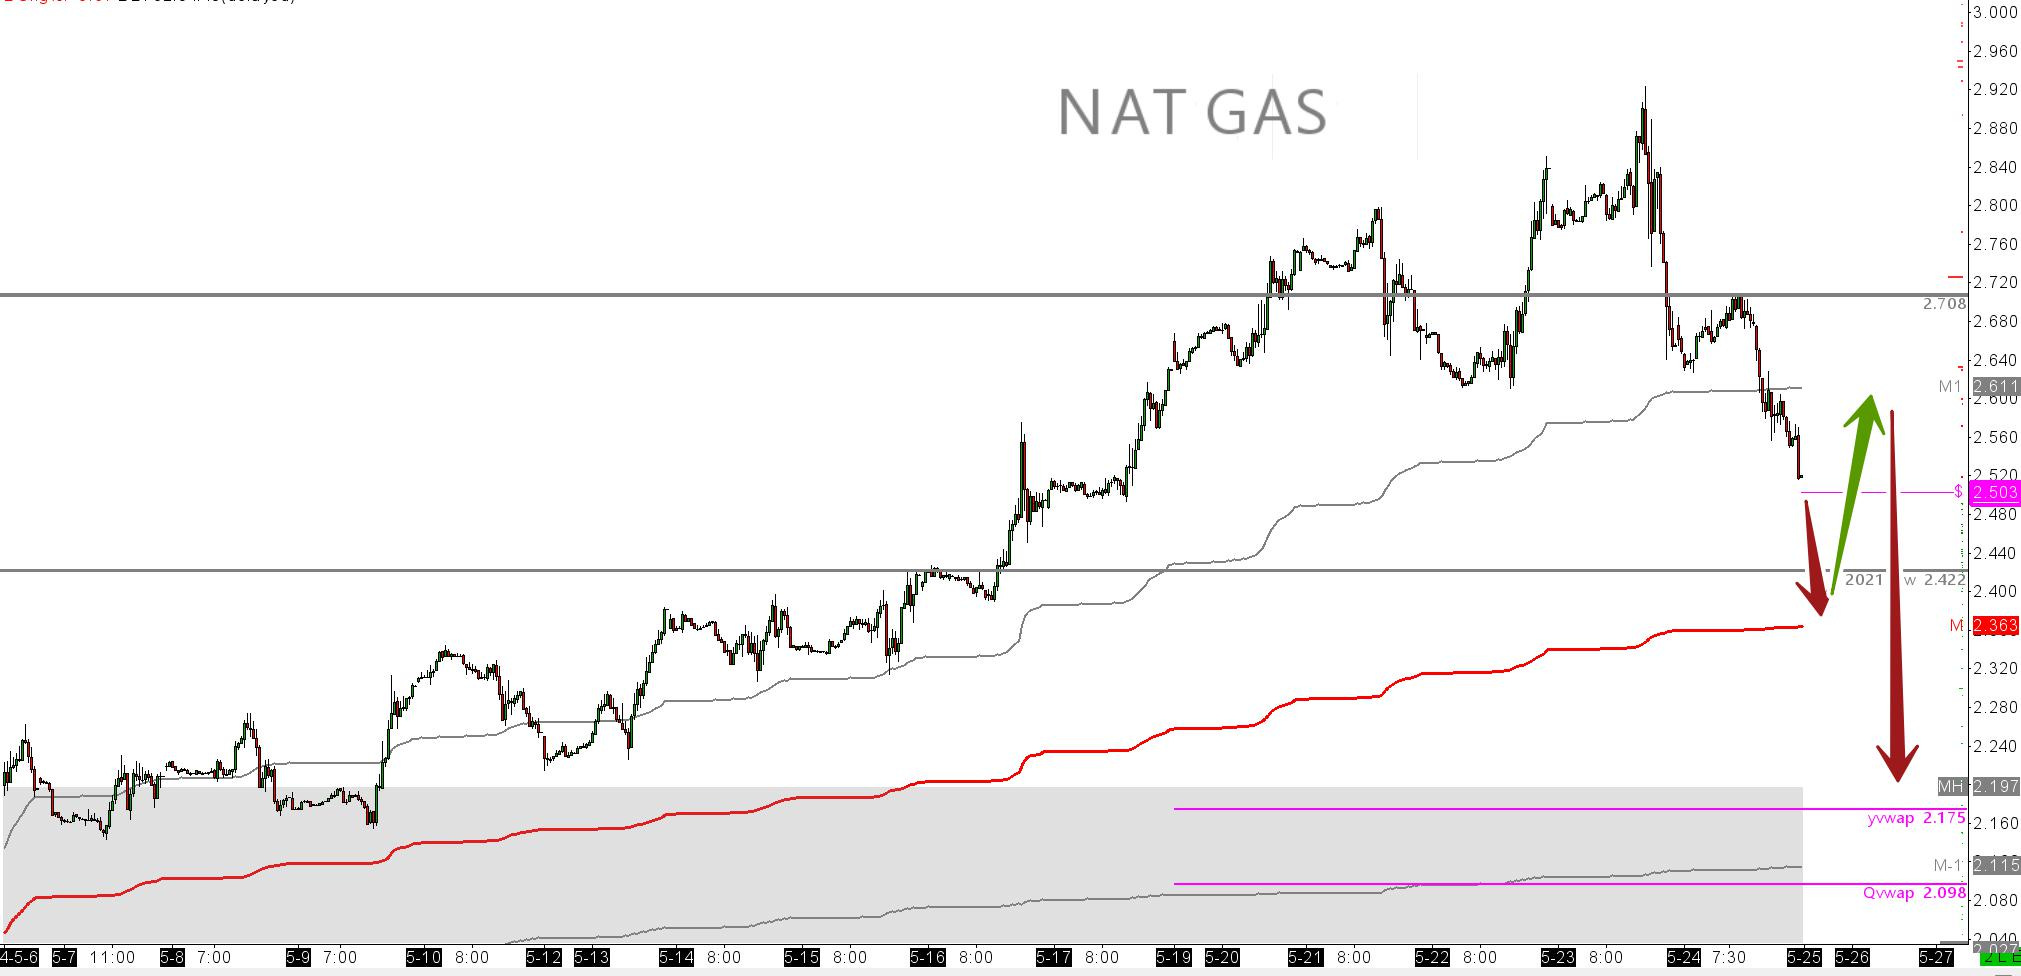
Anyways, THE BUYERS ARE BACK! Have a look at the daily chart. In the last 29 days we have moved up 58% from around $1.6 to $2.503.
With such a rally, we are staging a fantastic and potentially deep pullback.
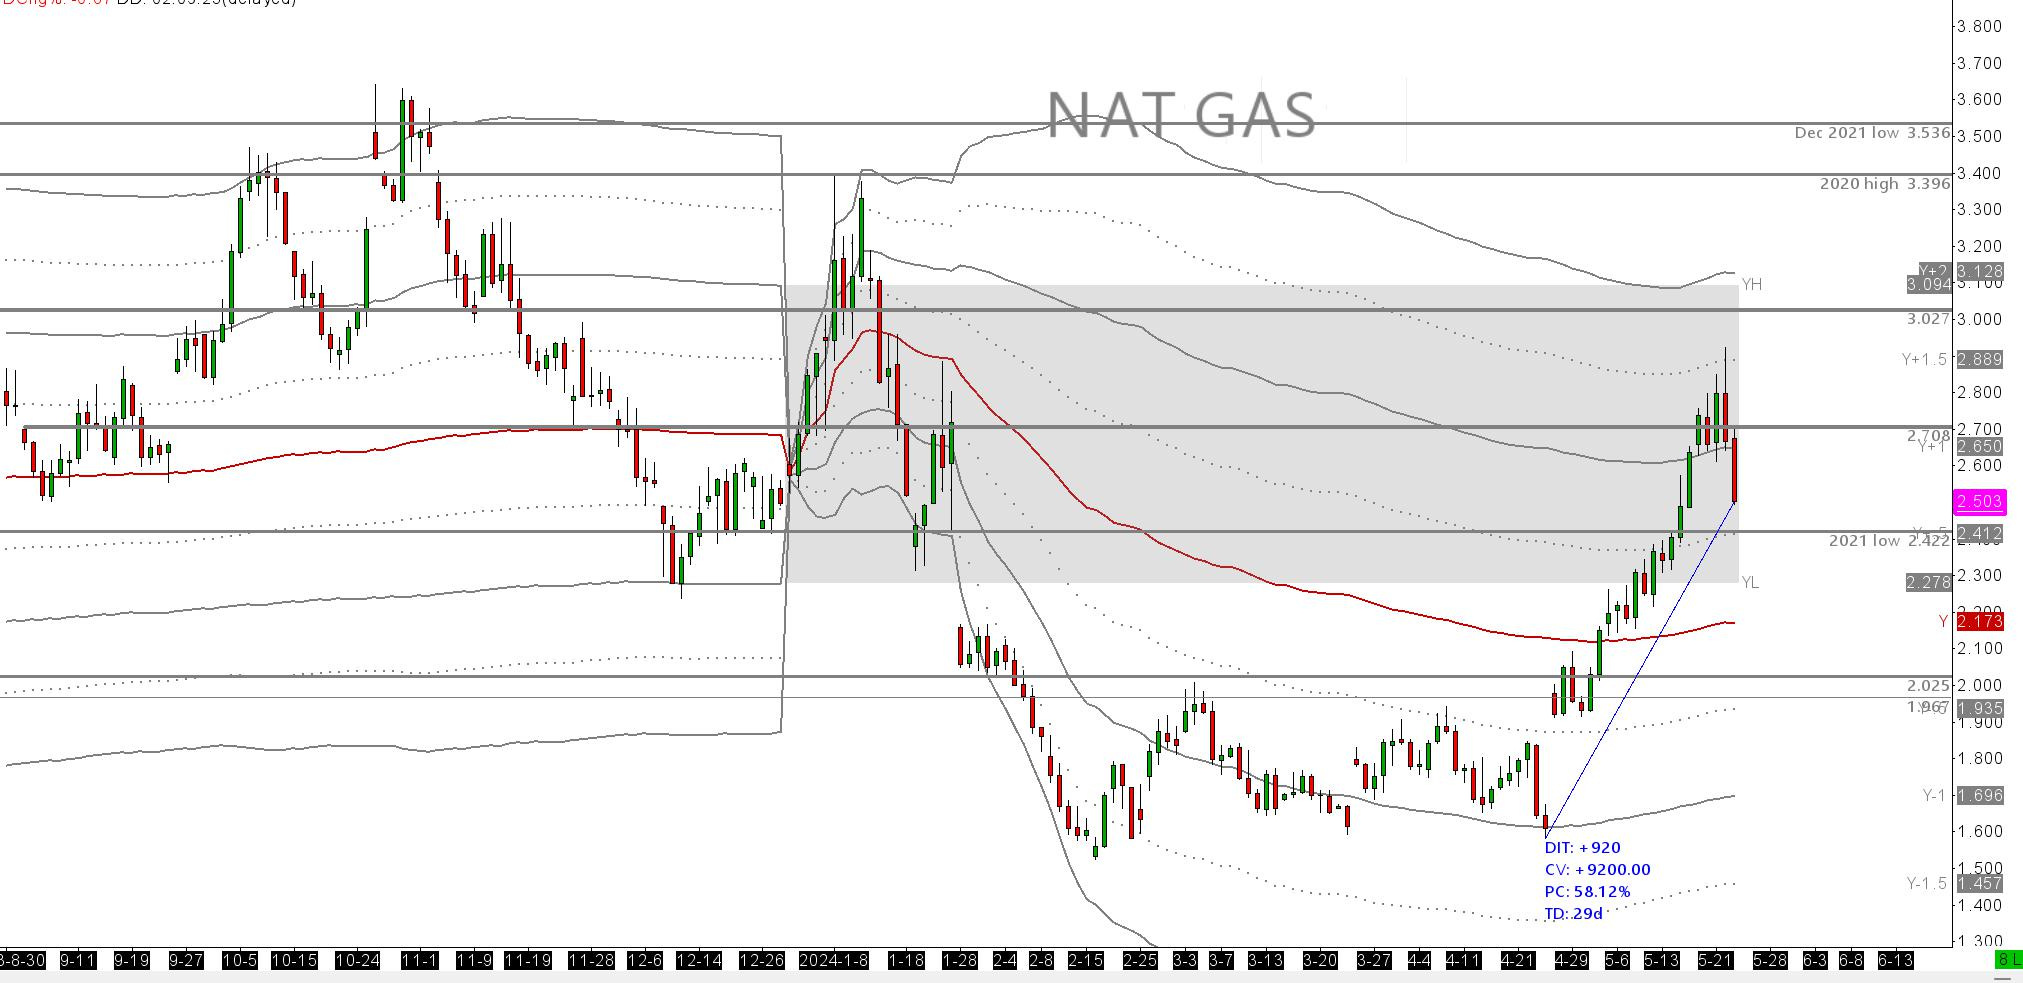
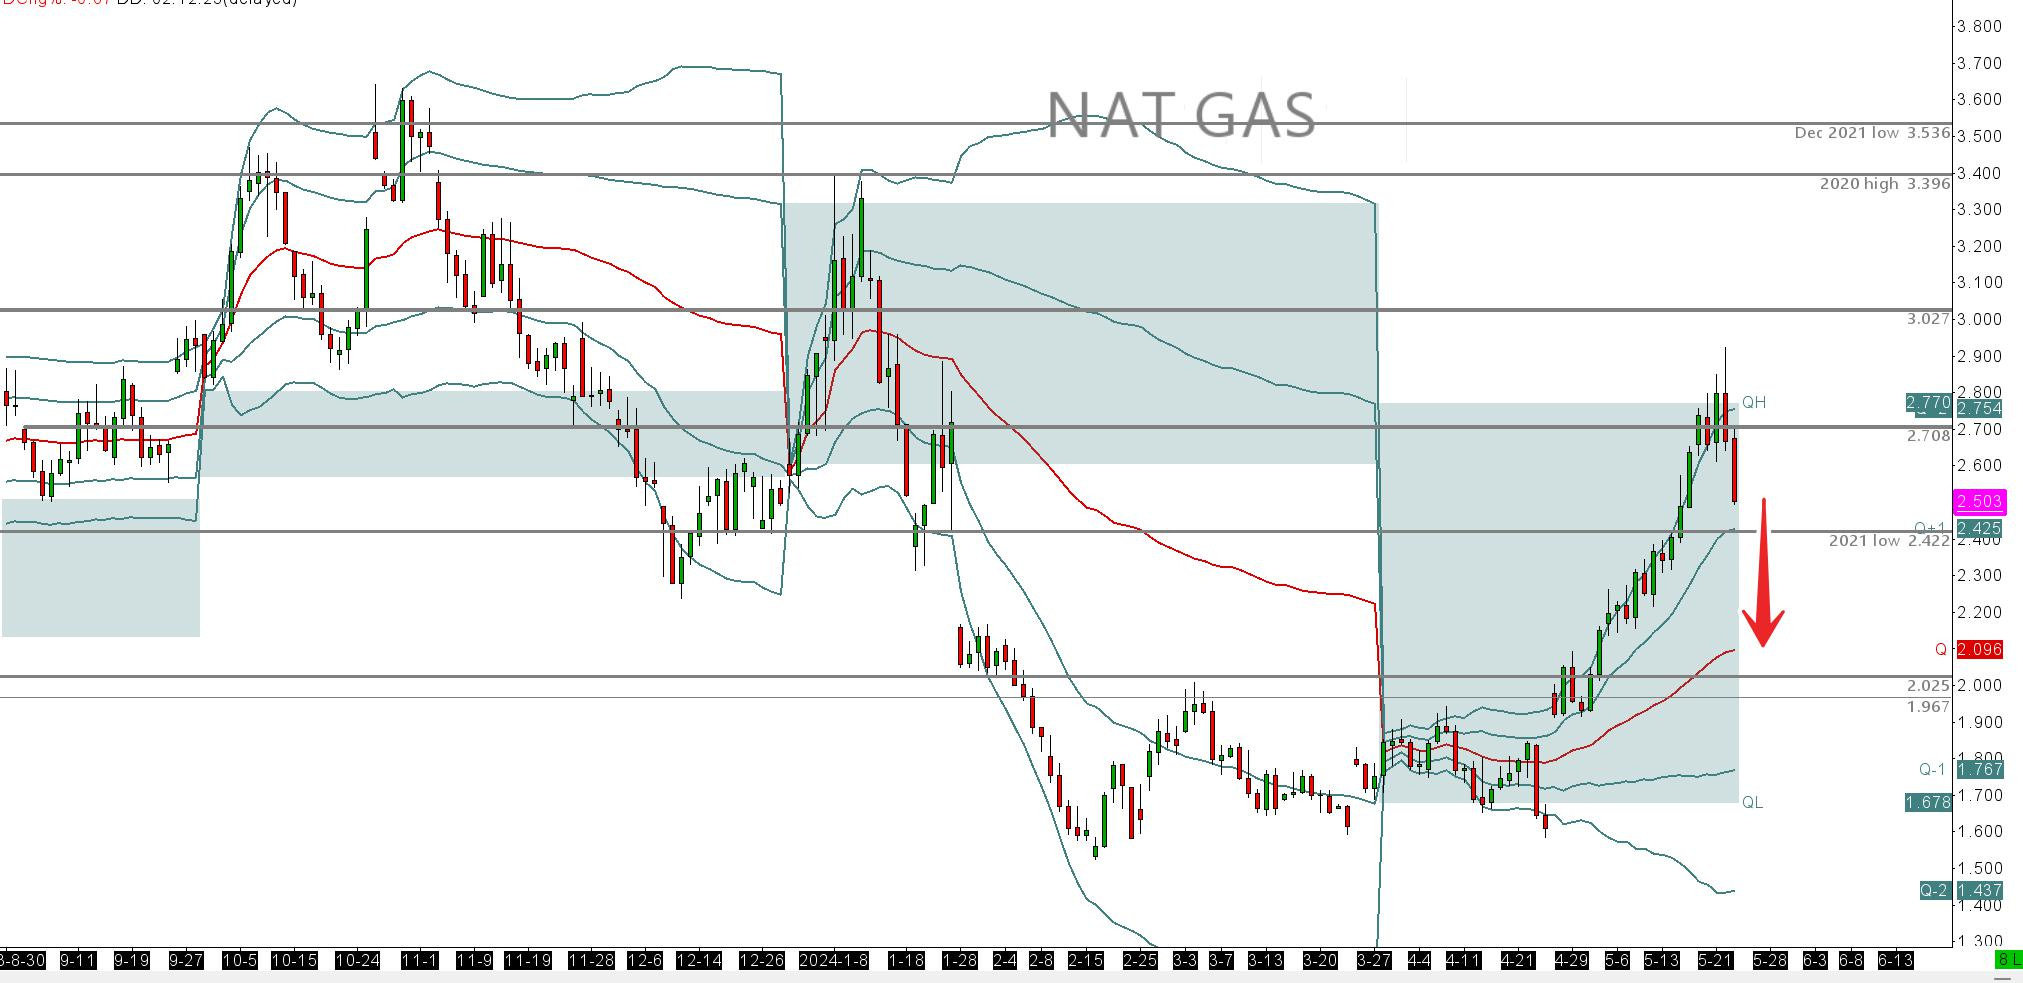
Looking at the Quarterly VWAP, we can see that we have had a massive rally from the Quarterly prior low $1.678- the auction start, all the way and out the top Q-PVAH $2.770. It is going to be worth monitoring over the next 2 weeks to see where the buyers want to come in and reaccelerate the market. I suspect it will be worth watching trade at the Q-VWAP Currently $2.096. However, because there was a lot of two way trade at the start of the Q auction, It may be a case that we have to come right the way back down in order to restart the auction again at $2.770 Q-PVAL.
If we overlay the Yearly and Quarterly, we can see there is an upcoming convergence of the 2 VWAPs. When they have both traded, we should get some clarity on direction of further trade. However, what is the trade this week? Let's move to the monthly VWAP.
As we can see, the market is retracing the last couple of weeks of good work. M-VWAP (currently $$2.363) seems like the destination and sellers will take it there in my view and lower. We should see SOME buying at the M-VWAP however, I think that this buying will fade out back up at the M+1, to then condition shift back down below MVWAP to test MPVAH $2.197. These are not small moves and we will check in next week to see how we did!
Equities
ESM24
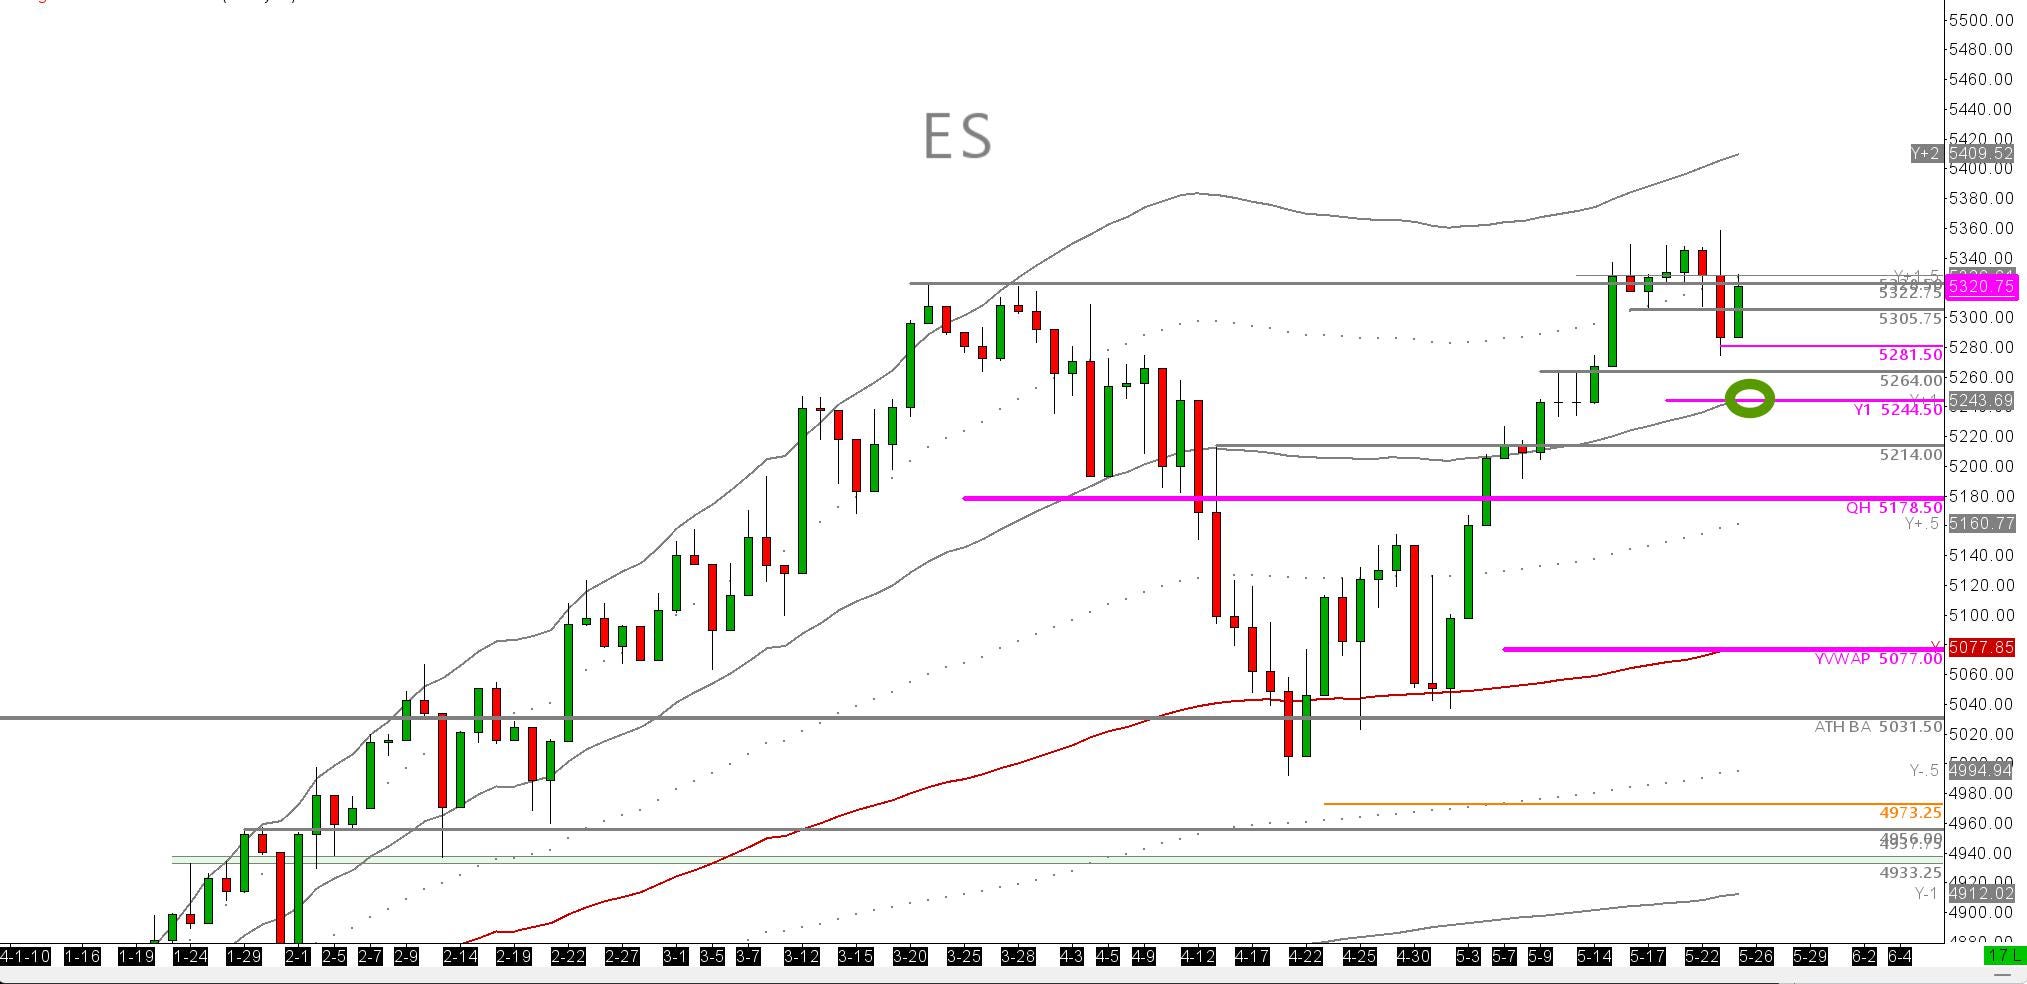
The basics are- ES is going up- for now. On the Yearly VWAP we are still imbalanced up ie. trade is still above the +1. The selling last week took a few by surprice. I spoke about this on youtube last week anbd we traded this live on the short side.
We sold down on an initial jobless figure that came out reasonably good. ie. Jobless number was a miss. Well, why would the market sell down on that? Surely its good for the economy right? Yes, but its not good for The Fed to be motivated to then cut in september. And when we got the figure, the market repriced down pretty dramatically. A 1.77% negative breath on the day - High to low. So the expectation that the market trades on is that,
Good data= more hawkish Fed/ higher for longer/ bad for price.
Bad data = Dovish Fed, potentially cut in 2024 earlier than later/ good for price
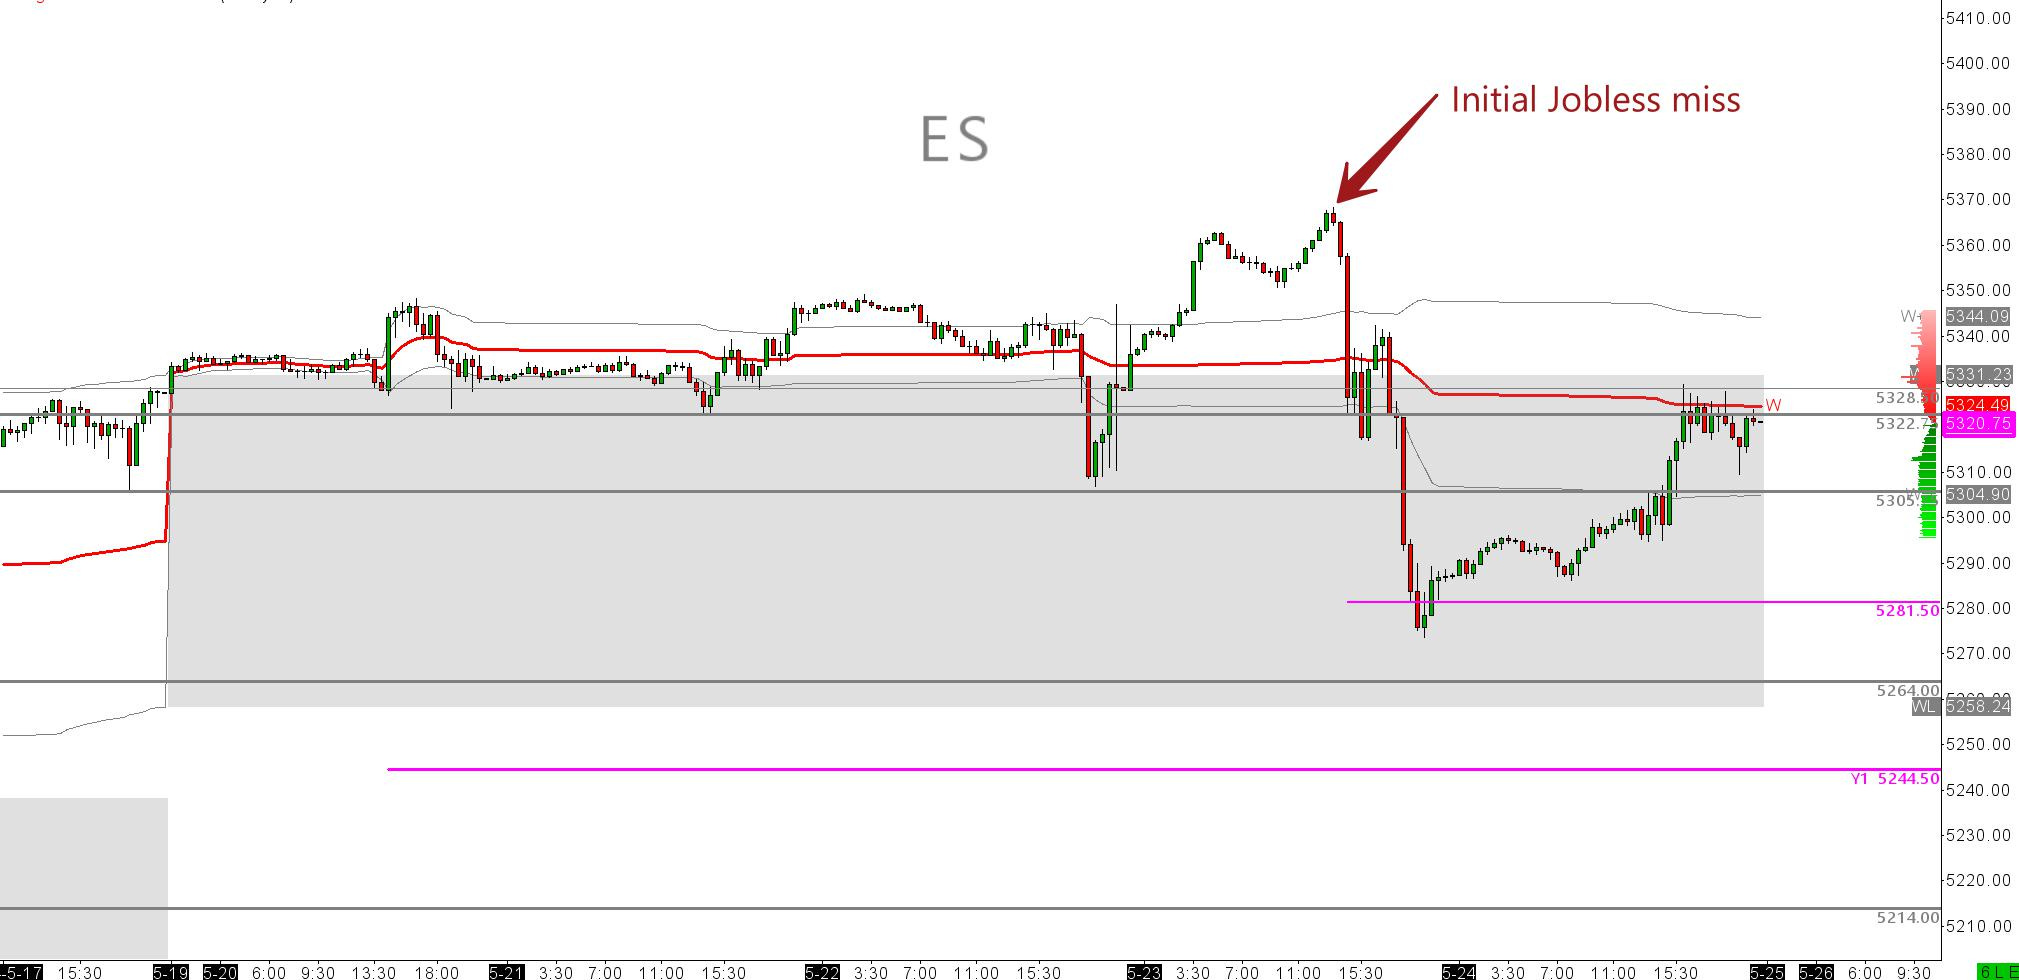
Resistance is futile, there is no such thing as bad news anymore. Daddy Fed will always be there to protect a 10% dip. So with that, how much higher are we going? Well, with a busy Thursday and Friday, the market will want to wait for Friday to really know what's going on with the economy. Will the market rally into Thursday/ fade off on Friday?
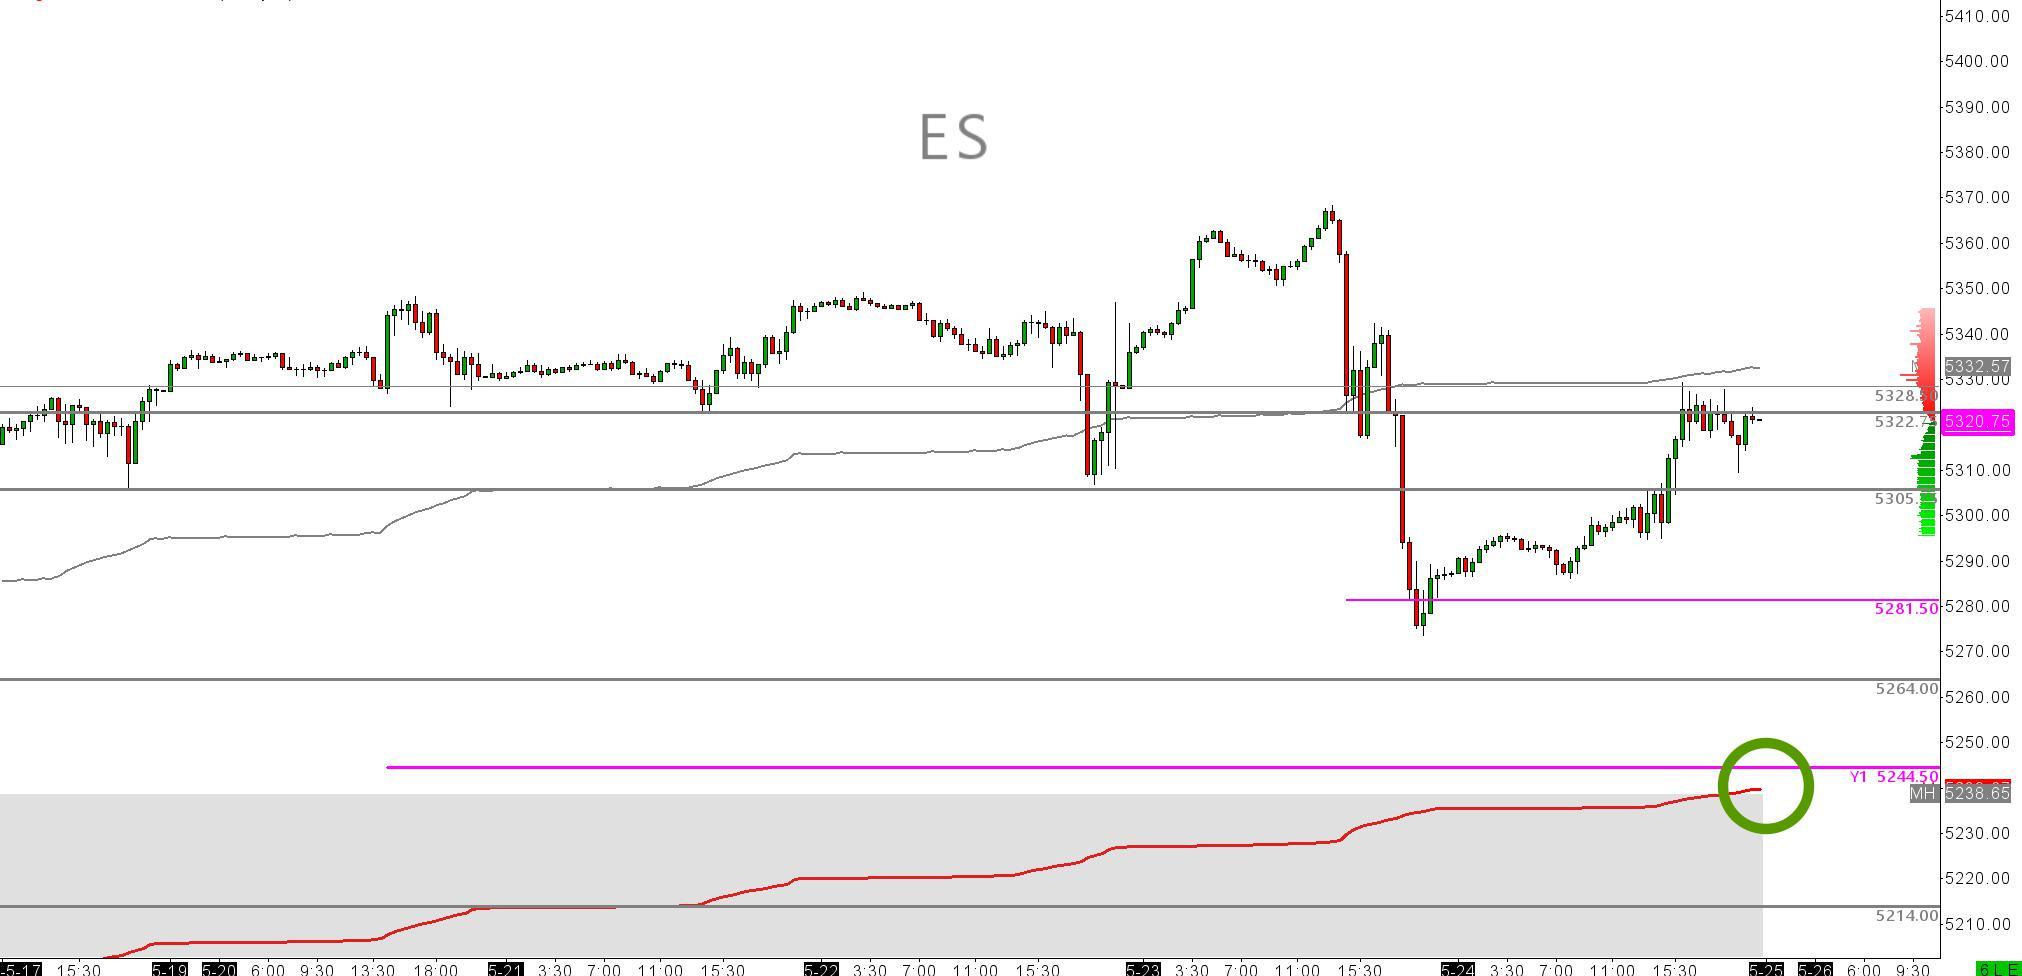
If we look at the VWAP on the month in ESM24, we can see the market is now caught inside/ ie. below Monthly +1 standard deviation. To me, my edge tells me that, if we test +1 now from below, sellers will drive into the car park and unload a can of selling there. Currently at $5332.50. Then drive that position down to M-PVAH $5238.65 which is also confluent with M-VWAP at the time of writing this. If the market starts then to auction below M-VWAP, there is still protection from the Yearly +1 AT $5243. If the market cannot hold Yearly +1, then its time to get the popcorn and we should trade down to Q-PVAH $5178.50 pretty fast. This is just technically what I see. I don't know what the catalyst would be, and most often I don't care. But it helps that there is a data event that can ignite volume if anything. Let the narrative fit later. Get the trading done first!
Keep it tight……and wait for the trade!
Tim