

There will be risks
Large volumes, Bad positioning and threadbare Confidence

Articles
There's another US debt downgrade warning
European Central Bank cuts interest rates, warns of 'deteriorated' growth outlook on trade tensions
Trump suggests he can remove Fed Chair Powell and says he’s ‘not happy’ with him over interest rates
Market Recap: April 14–18
We started off the week in disarray over there were or were not pauses or relief on tech tariffs. There were not. The prior Fridays markets had priced as if this was the case. It was not. When we opened, Monday, the market priced in the wrong narrative and there have been no signs it has figured this out either. THIS IS ESSENTIAL
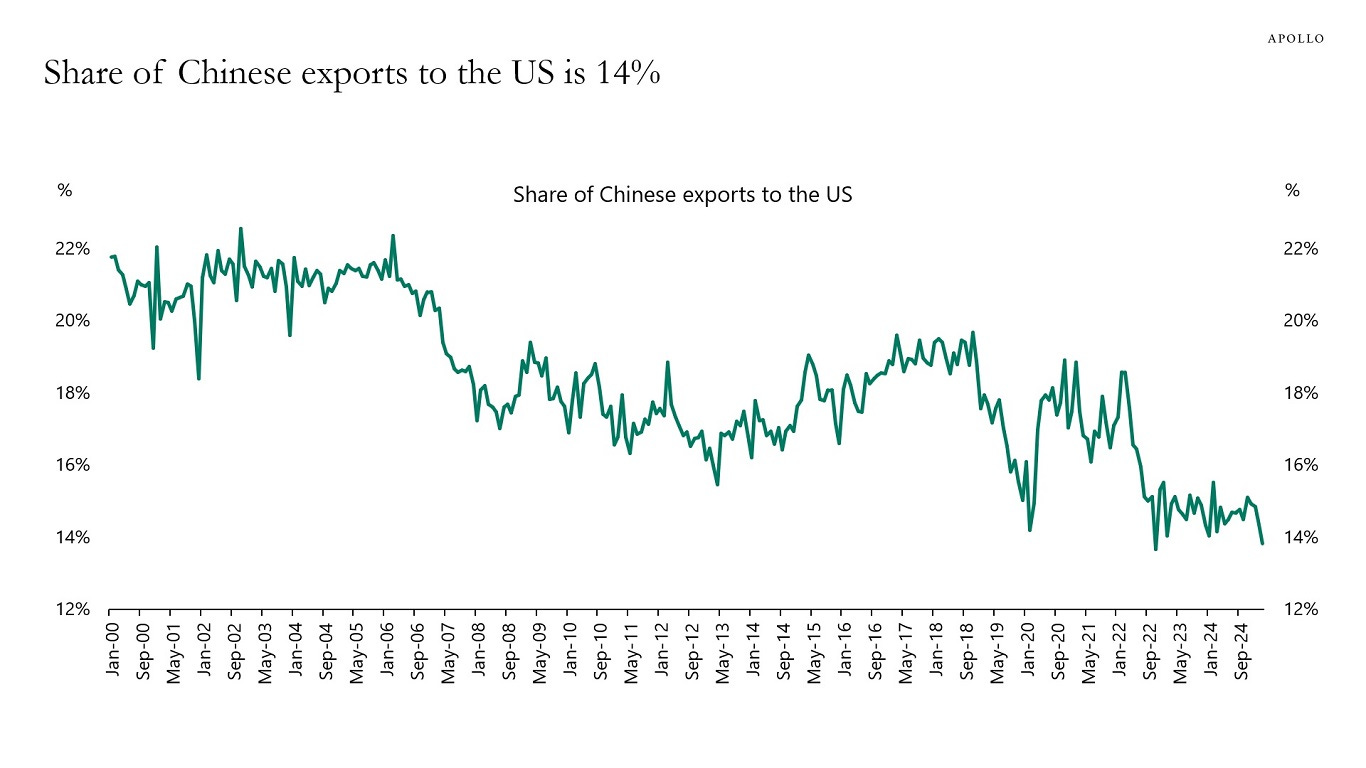
Markets remained volatile last week as trade tensions persisted. Trump's tariffs on Chinese imports, now exceeding 100%, have intensified the U.S.-China trade war, leading to an 80% projected drop in bilateral trade for the year. Despite these challenges, U.S. retail sales in March rose by 1.4%, driven by consumers making pre-tariff purchases, particularly in automobiles.

The labor market showed resilience, with initial jobless claims falling by 9,000 to 215,000 for the week ending April 12, beating economists' expectations. However, continuing claims increased by 41,000 to 1.885 million, US labor market stable; tariffs depress single-family homebuilding.
Economic Data
Tuesday (Apr 23): U.S - S&P Global Manufacturing & Services PMIs – early read on April economic activity.
Thursday (Apr 25): U.S - Weekly Jobless Claims, Durable Goods Orders – labor and capex trends.
Friday (Apr 26): U.S - March PCE Price Index – the Fed’s preferred inflation measure. High impact.
Earnings to Watch
Tuesday: Netflix, Johnson & Johnson – consumer behavior and healthcare sentiment.
Wednesday: Tesla, IBM, Procter & Gamble – key barometers across autos, enterprise tech, and staples.
Thursday: Microsoft, Intel, American Airlines – heavyweights that could swing sentiment.
Friday: ExxonMobil, Chevron – expectations are high after the oil rally.
Macro
The volatility seen 2 weeks ago was at a level that I have rarely seen. I have been a full time market participant in futures since 2017. Through that time, the highlights of comparable volatility have been volmageddon Feb 2018 and March/April 2020. The action is certainly max volatility with order books firing off in all directions. The day Trump announced his pause on tariffs (Wednesday 9th April) the SP500 printed 5.31% in 5mins was something I had never seen the like of before, closing up 9% on the day. That level of buying to me, was unprecedented.


We have now spent a week drifting and attempting to stage another footing for a rally. In last weeks report I highlighted that there was unfinished business on the SP500 Lows. I still believe this and I’m short this market via options.
In talking with one money manager friend over this week and in listening to other money managers, it stands out that retail and managed money have bought this dip. And why not, Trump has paused the tariffs after all…….
The ‘sophisticated’ view is this
We rally back up through earnings season as the numbers are pre tariff turmoil. Highs to new highs.
Once this is done, high frequency data starts to look dower, accounting for tariffs and weaker DXY picture. This causes downside on equities.
Further through May into June, tariffs deals are shaping up for the positive in US favour and yes, its all over- we move to hold new highs.
I get it. I like it. But I’m not trading this view.
For me, I just want to take the first order consequence into account here and not forecast 3 steps at once. There is instability in the system, DXY is weak as a kitten and gold remains extremely well bid. See charts below. The risks are not gone under a pause and we still could print 10% either direction on sentiment from one tweet.
Remember 3 weeks ago when I was saying the selling was orderly? Well, I wasn’t crazy. Then it DID get crazy. Its important to still be aware why the market went from controlled selling down to unhinged selling and then buying. Participants were holding puts for most of the way down. Then they unwound the puts and got long on the ‘tariff pause’, buying the dip. Now the risk is, the market is long since April 9th and it seems like in the week past, has bought put protection. So we could have another controlled push down, forcing the non protected out. More importantly, a rinse repeat of the controlled selling we saw previously. If we retest lows on the year, its going to be sick bags for retail, and I can easily see the VIX explode even higher than current highs on year. I suppose this is a contrarian view. But, should the dip buyers be forced to puke that position, it will be a spectacular double dip. To clarify, I don’t think there is systemic risk AT ALL. Recession/no recession- is above my pay grade.
There is simply large volumes, bad positioning and threadbare confidence.

Does America have the cards?
Trade
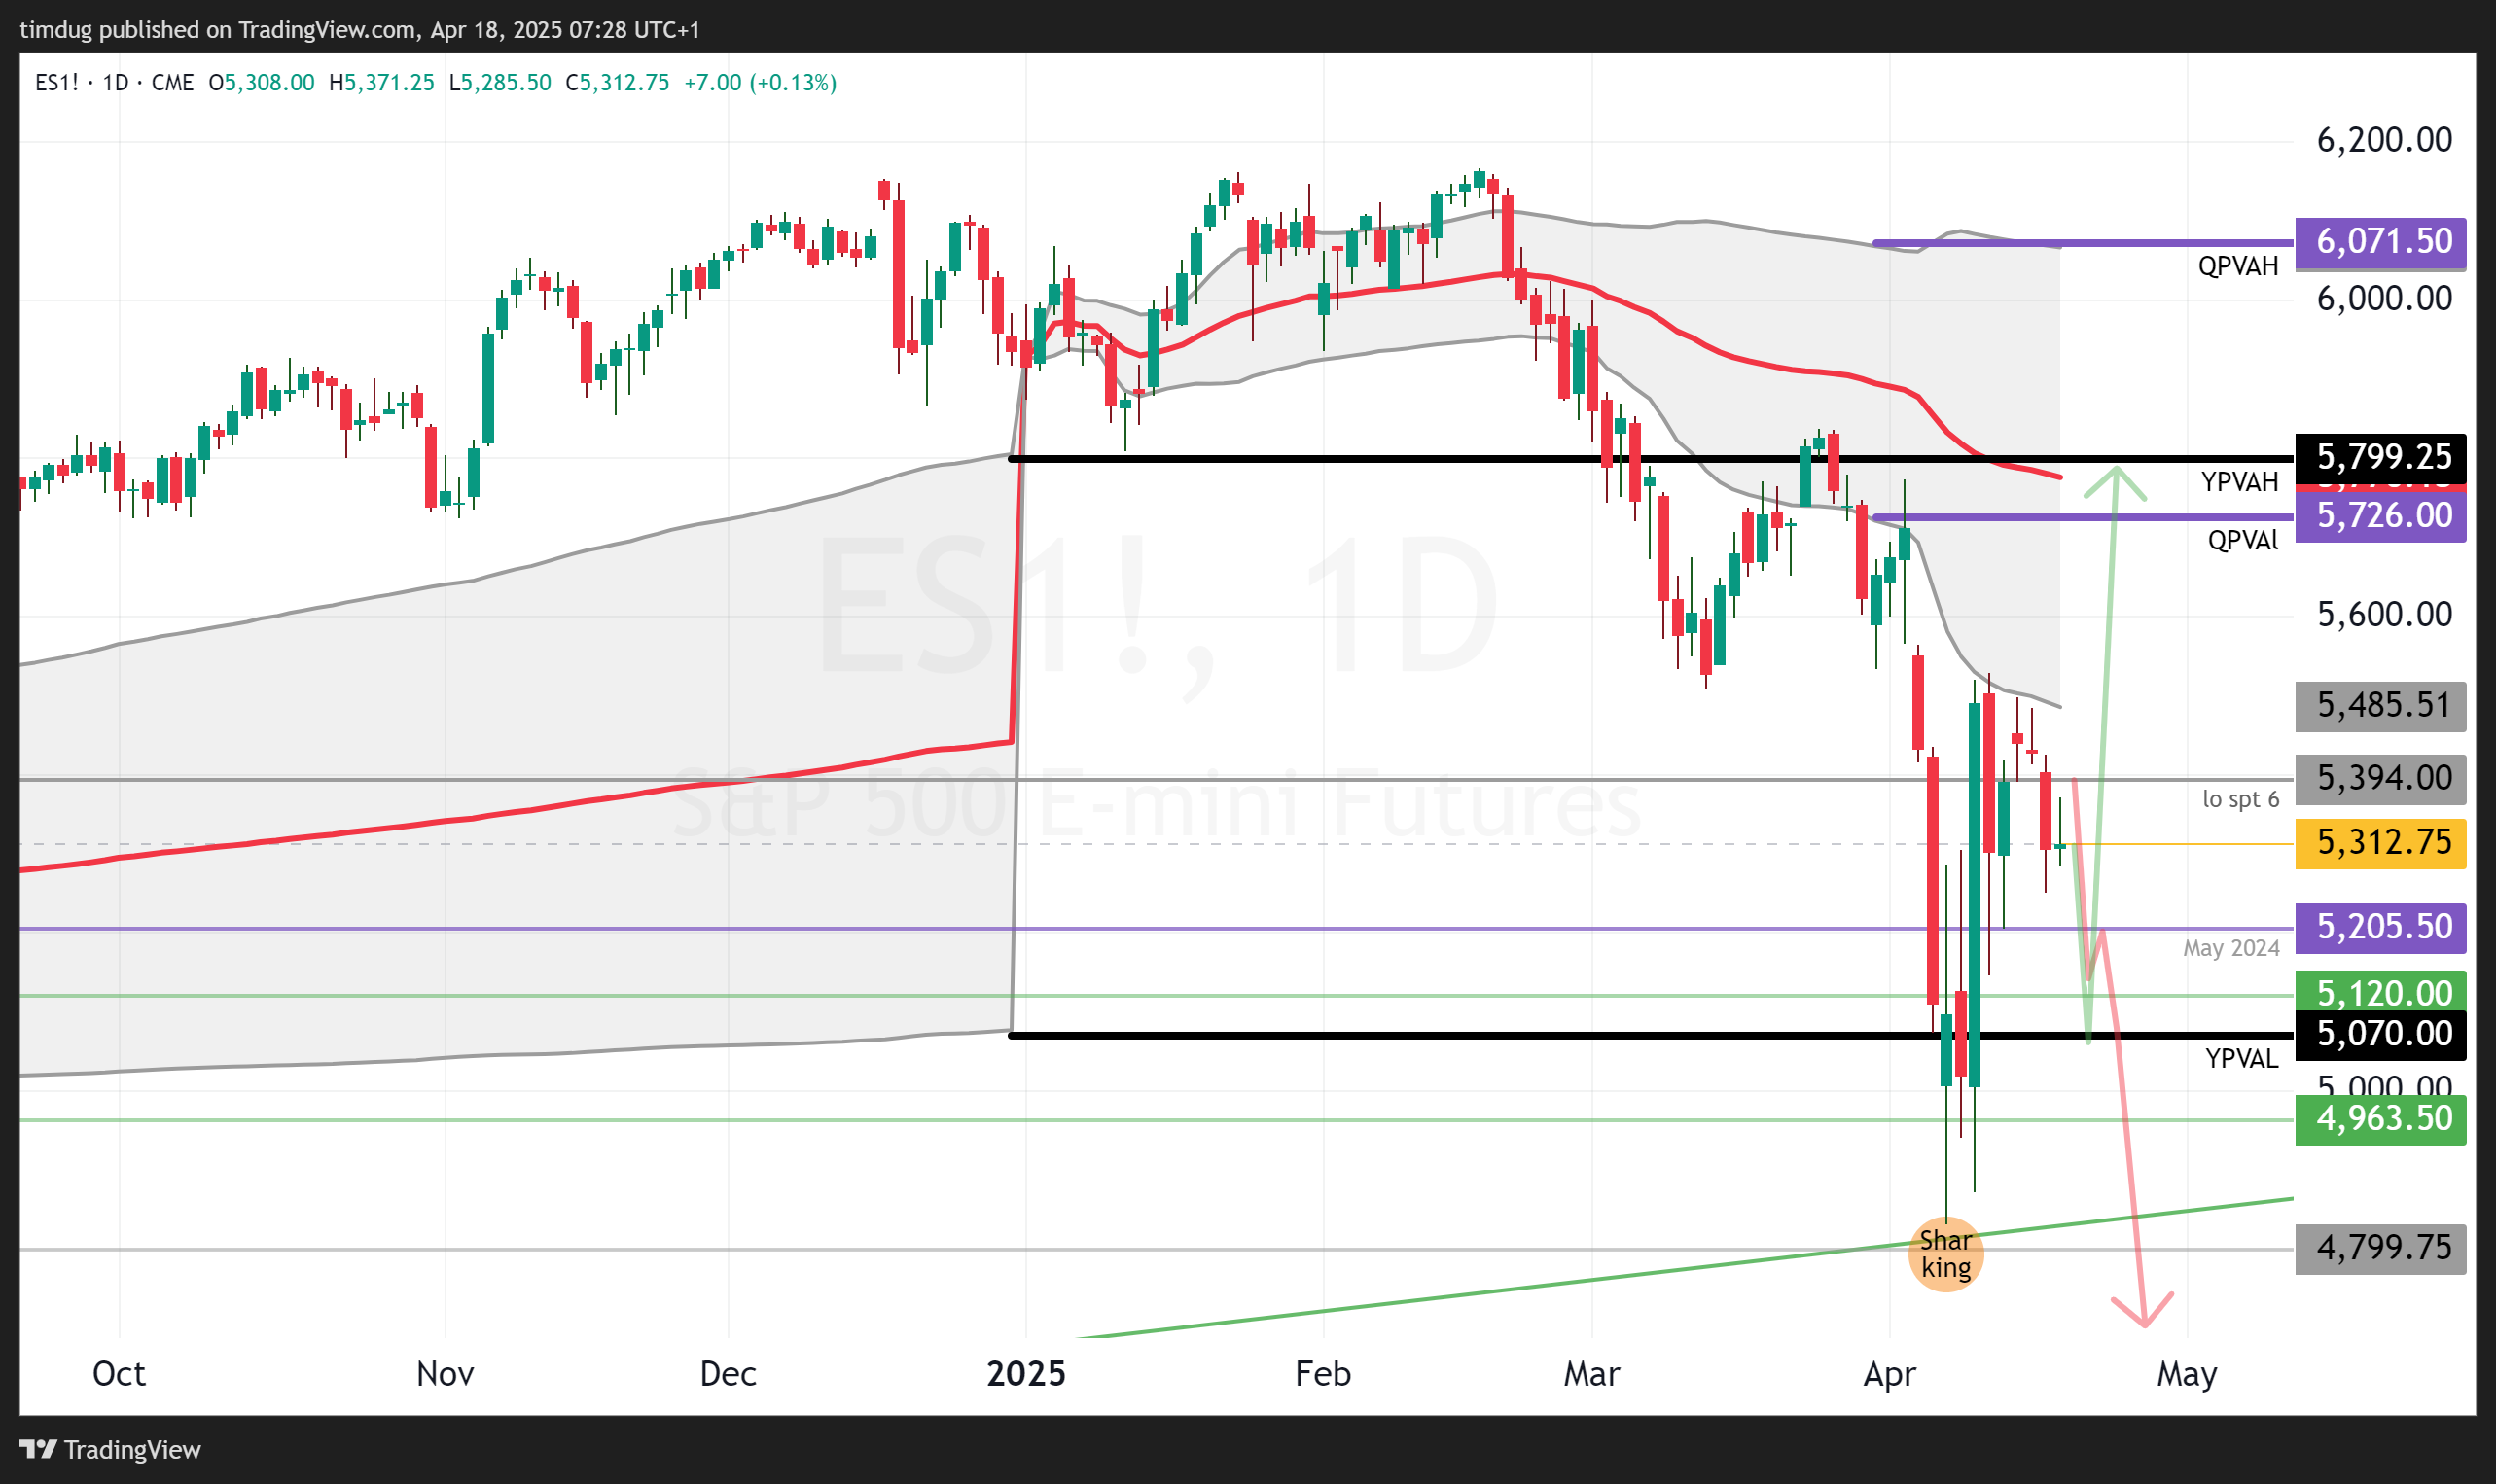
ES

YM Dow
This chart shows how the sellers loaded up on the Y-1 Nicely. Confluent with resistance at the lows MArch 13th. The break point is where we closed on Thursday. If buyers take it on the reopen for electronic on Sunday night/ Monday, the relief rally is probably on for equities. An important level for the dip buyers to hold.

VIX

DXY


6S Swiss Franc index
When I look at this chart, Its clear to see the flight is alive to the safety of Swiss Franc. It would be reasonable for this to have a controlled pull back to the October 24 highs. In this case, we would probably bid back up on U.S equities while the world takes a break from risk. HOWEVER It is not in my nature, edge or disposition to take ANY action on markets that this extended. This is EXACTLY the market situation we saw with gold 2 months ago, AND IT KEPT GOING UP. So this can stay high and move higher as it is imbalanced up! In fact I could only trade this should it pull back to Y+1. I will trade this should Y+1 and the Oct 2024 highs converge.

6J Yen
This is nicely imbalanced up. The pullbacks around April 8th to Y+1 were beautiful for loading up on the longs and we did indeed rally out of there into new highs on year. I see a pullback to YPVAH a nice reload for buyers to eventually make it to the higher levels. See monthly bar chart for the big view as below.


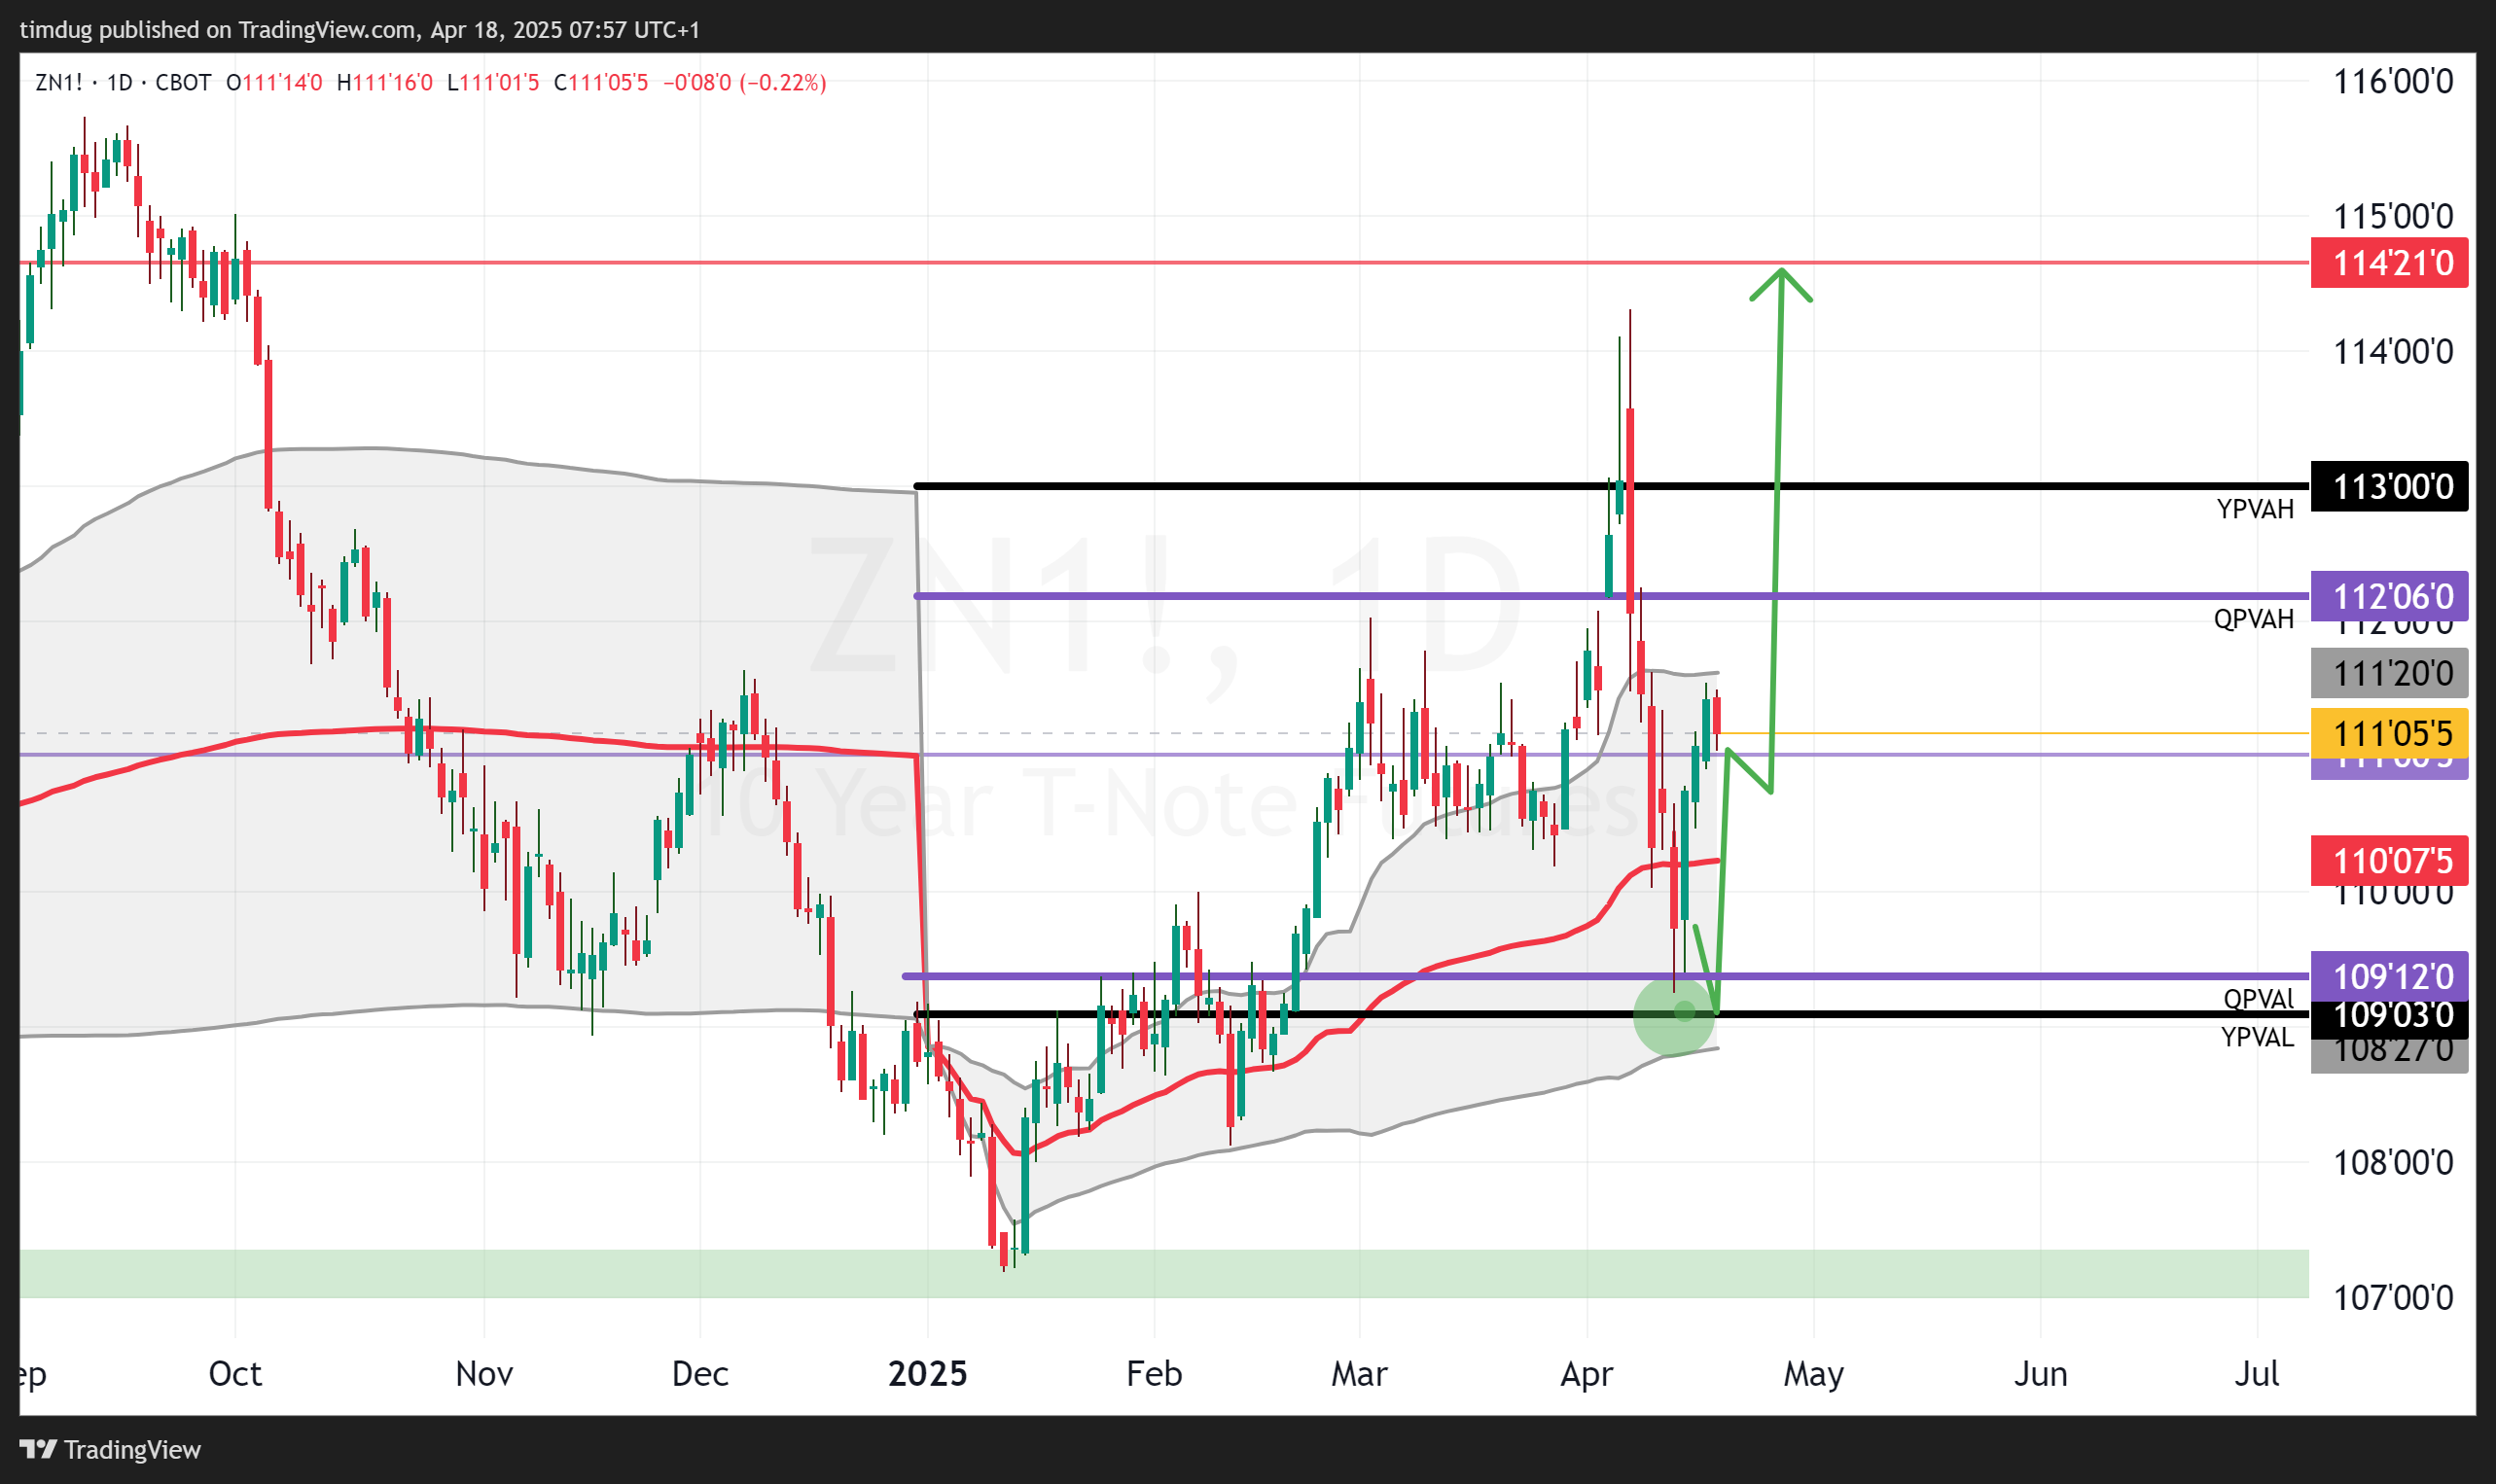
US 10 Year ZN
The daily bars on this chart are the same as last weeks charts. Nice buying ops from last weeks guidance. I don’t have anything new to add here. Bonds to remain bid up.

Alright that’s all for this week. Market volumes will be light Monday given the Easter bank holiday and market were closed on Friday. Nonetheless, the electronic reopen will be of HIGH interest to me on Sunday night/ Monday. For now, forget about all that and go enjoy the holidays.
Enjoy the eggs!
Tim
